Summary for farmers
- Adding phosphate salts helped shrimp digest phosphorus better: 84–86%, compared with 75% in feed without them.
- After 96 days, shrimp on the four feeds grew almost equally, reaching 12.9–13.6 g/shrimp.
- The more phosphorus in the feed, the smaller the share the shrimp retained: 11–13%, compared with 17%. The rest is lost in the feces and to the water.
- The ammonium-based salt brings in extra nitrogen that is not protein, making the protein figure on paper higher than the true protein.

Shrimp need phosphorus to grow, build their shells and molt. But which phosphorus source should be added, how much of it can the shrimp use, and how much ends up in the water? A team of Spanish scientists tested three phosphate salts in whiteleg shrimp feed. The results were published in the journal Animals on September 23, 2025.
1. Why add phosphorus to the feed?
Fishmeal is rich in phosphorus. Today's feeds use less fishmeal and replace it with plant proteins, which contain little phosphorus that shrimp can use. That is why a phosphorus source such as phosphate salts has to be added. The study compared three types:
- MAP: monoammonium phosphate, an ammonium-based phosphate salt.
- MSP: monosodium phosphate, a sodium-based phosphate salt.
- SCP-2%: a sodium/calcium phosphate blend, made of 12 parts sodium-based and 88 parts calcium-based phosphate.
The “2%” in the name SCP-2% is the sodium content of this phosphate source, not an inclusion rate of 2%. In the trial, SCP-2% was added at 21.4 g/kg of feed.
2. How was the trial set up?
All four feeds contained 10% fishmeal and were formulated for 35% protein and 10% lipid (on a dry-matter basis). The control feed had no added phosphate salt and contained 0.66% phosphorus. The other three had phosphate salts added to reach 1.16% phosphorus.
| Parameter | Control | MAP | SCP-2% | MSP |
|---|---|---|---|---|
| Phosphate salt added (g/kg feed) | 0 | 18.9 | 21.4 | 20.8 |
| Phosphorus (% dry matter) | 0.66 | 1.16 | 1.16 | 1.16 |
| Calcium (% dry matter) | 0.55 | 0.65 | 0.80 | 0.56 |
| Calcium/ | 0.81 | 0.58 | 0.72 | 0.49 |
The calcium/phosphorus ratio was not the same in the four feeds, because each phosphate salt naturally contains a different amount of calcium.
The trial was run indoors, in 90-liter tanks in a recirculating aquaculture system (RAS), at the Universitat Politècnica de València (Spain), and had three parts:
- Growth trial: 16 tanks, 4 tanks per feed, 20 shrimp per tank. Shrimp were stocked at about 0.5 g/shrimp and grown for 96 days. They were weighed every three weeks to adjust the feeding amount.
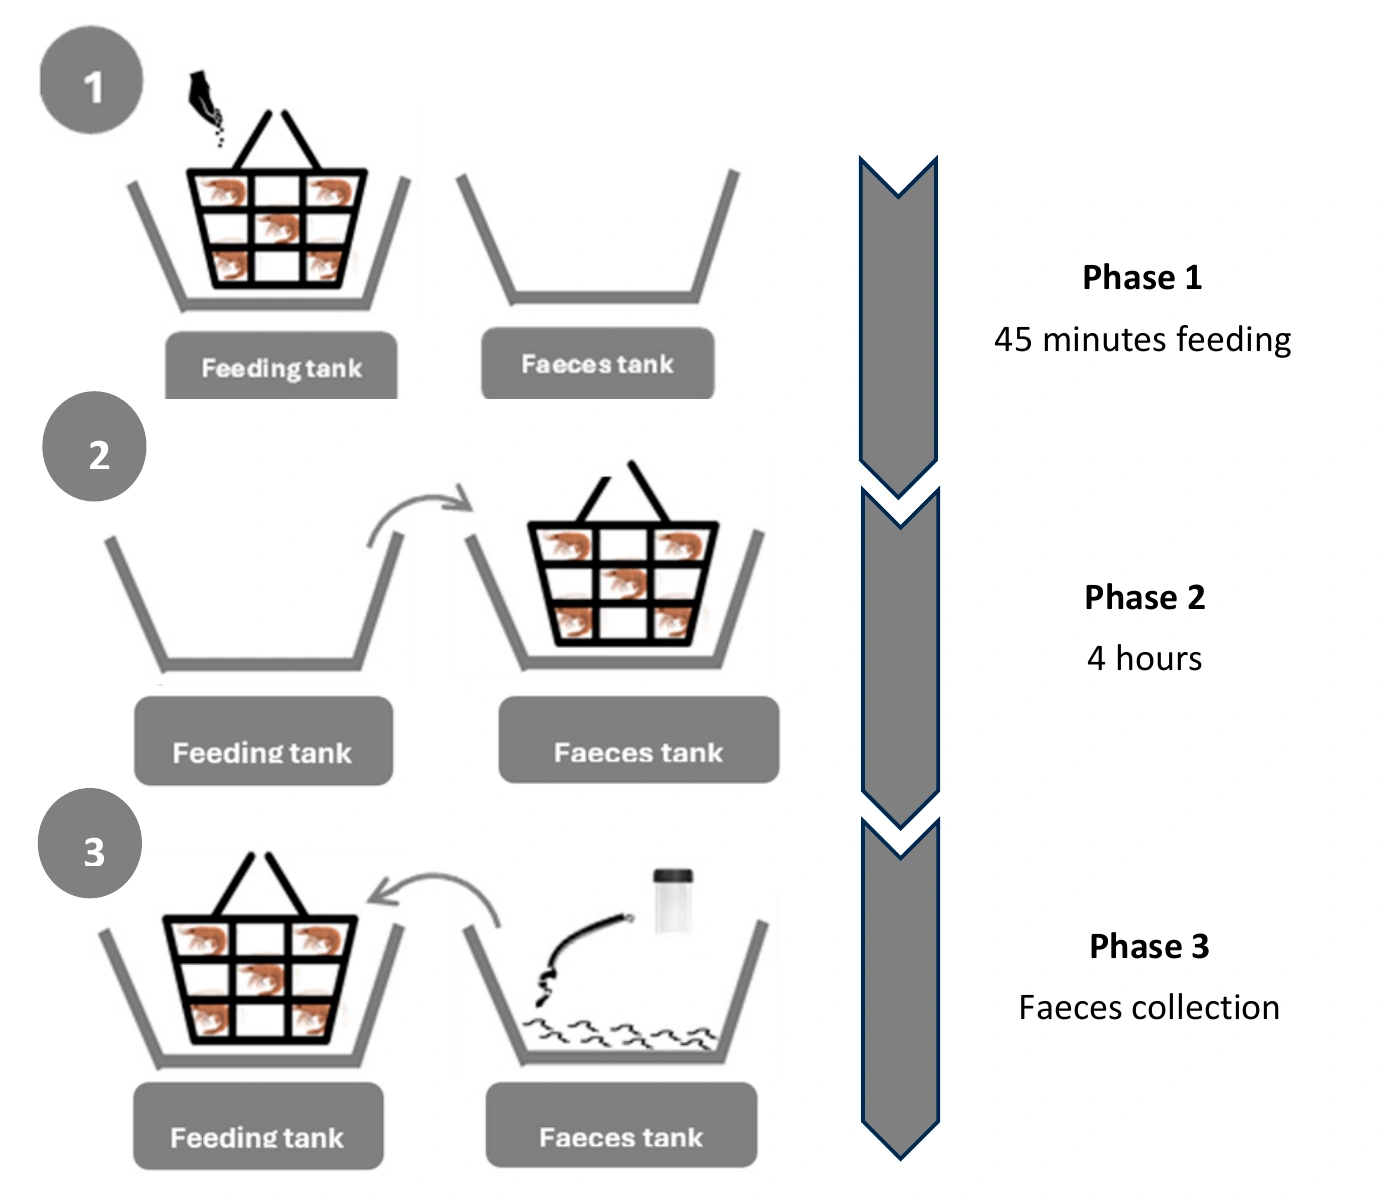
- Digestibility trial: shrimp of about 15 g. The feed contained an added marker that shrimp do not absorb; comparing this marker in the feed and in the feces shows how much the shrimp absorbed. The four feeds were rotated across four tanks, with each feed replicated four times.
- Dissolved waste measurement: shrimp of about 20–21 g; water was sampled several times over 24 hours.
3. How much phosphorus can shrimp digest?
“Digestibility” here means apparent digestibility: the percentage of a nutrient eaten by the shrimp that is not excreted in the feces. The original paper calculated it at two levels:
- digestibility of the whole feed pellet;
- digestibility of the added phosphate salt alone, calculated from the difference from the control feed.
| Parameter | Control | MAP | SCP-2% | MSP |
|---|---|---|---|---|
| Phosphorus, whole feed | 75.4 | 84.3 | 84.3 | 86.0 |
| Phosphorus, phosphate salt alone | – | 96.1 | 96.1 | 100.0 |
| Calcium, whole feed | 34.0 | 40.3 | 55.2 | 42.2 |
| Calcium, phosphate salt alone | – | – | 93.1 | – |
A “–” means not calculated, because the control has no phosphate salt, and MAP and MSP contain almost no calcium.
The three feeds with added phosphate salts had better phosphorus digestibility than the control: 84.3–86.0% versus 75.4%. Among these three, the differences were not statistically significant.
For the phosphate salt alone, the sodium-based salt (MSP) reached 100%. This was significantly higher than the ammonium-based salt and SCP-2% (both 96.1%).
Note: the “above 96%” figure refers to the phosphate salt alone, not to all the phosphorus in the feed. The 100% for MSP is a calculated value under the conditions of this trial.
For calcium, the SCP-2% feed had the highest digestibility (55.2%), significantly higher than the other three. The calcium in SCP-2% on its own was 93.1% digestible.
4. Did the shrimp grow faster?
No difference was found. After 96 days, weight, survival and feed conversion ratio (FCR) differed only slightly, not enough to say that any feed was better.
| Parameter | Control | MAP | SCP-2% | MSP |
|---|---|---|---|---|
| Final weight (g/shrimp) | 13.4 | 13.0 | 12.9 | 13.6 |
| Survival (%) | 79.02 | 89.10 | 82.11 | 84.00 |
| Feed conversion ratio (FCR) | 2.63 | 2.48 | 2.44 | 2.43 |
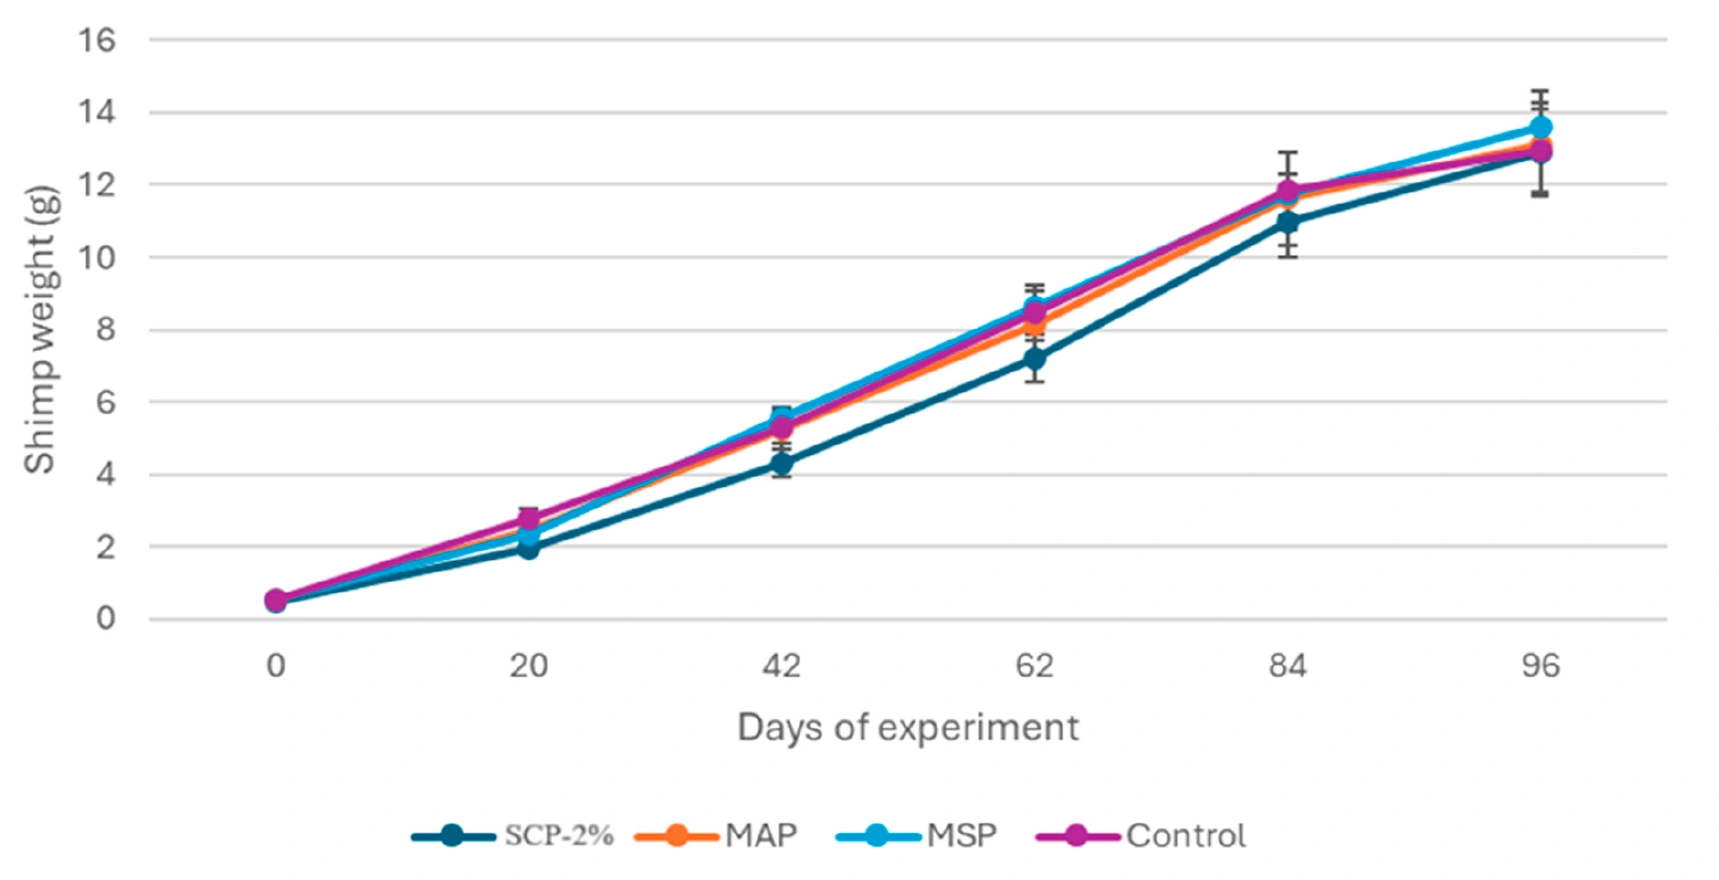
The control feed (0.66% phosphorus) was below the shrimp's requirement, yet the shrimp still grew just as well. The authors cite another study: phosphorus-deficient shrimp may make up for minerals by eating their molted shells. The authors also note that at large production scale, shrimp fed low-phosphorus feed may run into problems that the trial tanks did not reveal. So this result does not mean supplemental phosphorus can be left out. The trial also did not measure immunity or disease.
5. How much do the shrimp retain?
Digestibility is the part not lost in the feces. Retention is the part that actually stays in the shrimp's body. What has been absorbed can still be excreted into the water in dissolved form.
Phosphorus retention in shrimp on the control feed was 17.1% of the phosphorus eaten. On the three feeds with added phosphate salts, it was only 11.3–12.7%, significantly lower. The more phosphorus in the feed, the smaller the share the shrimp retained.
The same was true for calcium. Shrimp fed MAP and SCP-2%, the two feeds higher in calcium, retained significantly less calcium (49.1% and 40.1%) than those fed the control and MSP (55.2% and 54.2%). Nitrogen retention (19.8–23.4%) and whole-body composition did not differ between feeds.
6. Nitrogen from the ammonium-based salt, and waste released into the water
The ammonium-based salt (MAP) contains nitrogen. In the paper, crude protein was calculated as nitrogen multiplied by 6.25, so the nitrogen from MAP raises the protein figure even though it is not true protein. The MAP feed contained 6.06% nitrogen, 0.38–0.51 percentage points more than the other three. This works out to 37.96% crude protein, while the other three had only 34.73–35.52%. The authors consider that this extra nitrogen should have been accounted for when formulating the feed.
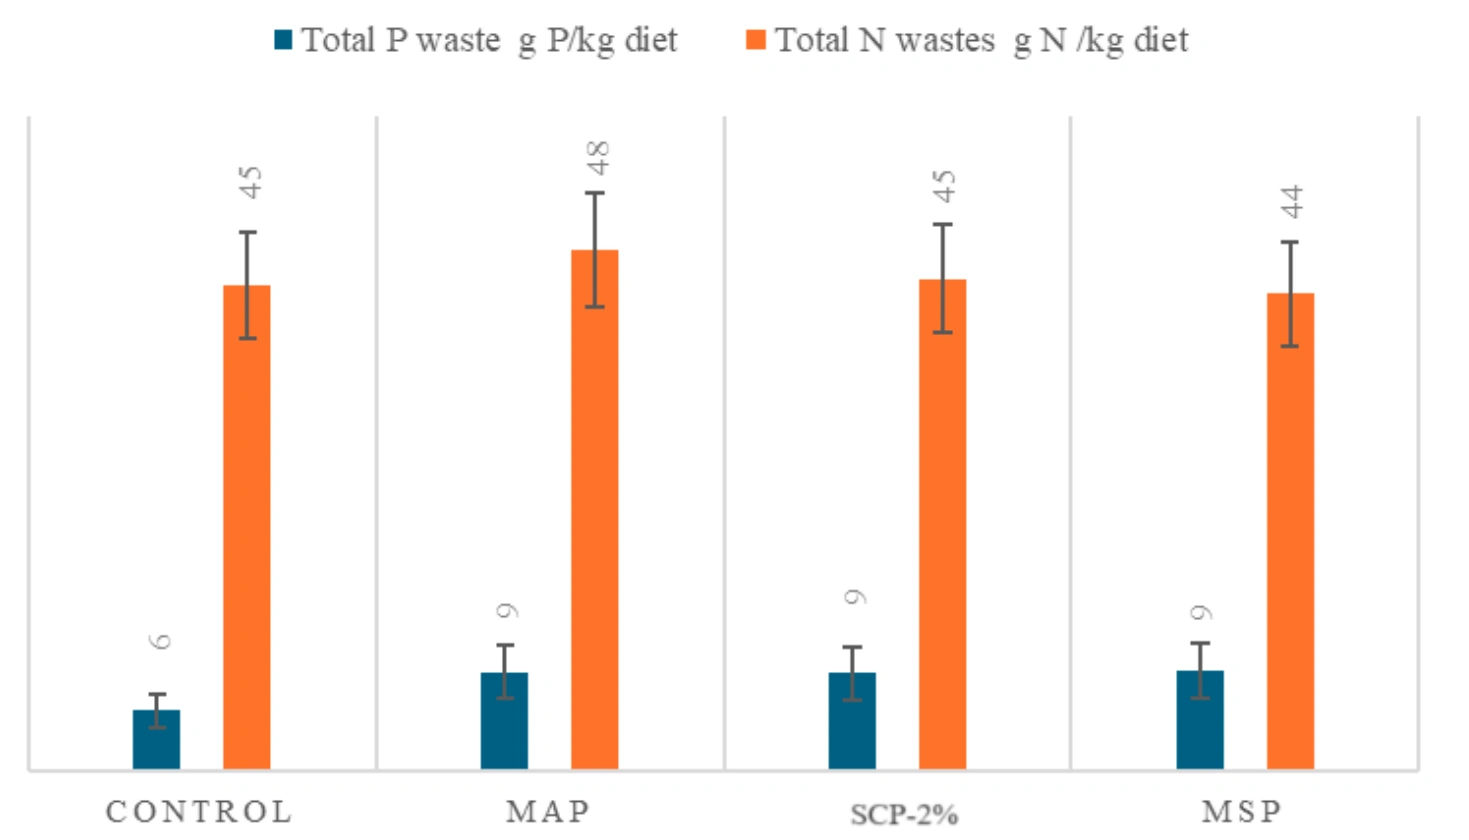
Daily ammonium excretion was 31.62–39.15 mg per 100 g of shrimp, highest with MAP; dissolved phosphorus was 5.72–11.53 mg. These differences were not statistically significant. Even so, the authors see the higher nitrogen excretion with MAP as a trend that should be taken into account.
7. Limitations and what this means for ponds
This was a trial in RAS tanks with stable water: about 27.7 °C, dissolved oxygen 6.36 mg/L, and ammonium and nitrite below the detection limit. The study only tested phosphate salts in the feed, not minerals broadcast into the pond.
What Than Vuong takes from the paper:
- Total phosphorus does not yet tell you how much the shrimp can use; different sources have different digestibility.
- In the trial, extra phosphorus did not make the shrimp grow bigger, and it lowered the share they retained. The authors recommend supplementing just enough, not above requirements, to reduce the risk of eutrophication of the pond water.
- With the ammonium-based salt, the protein figure calculated from nitrogen can be higher than the true protein.
- According to the authors, in low-salinity water, calcium and magnesium may need to be supplied through the feed. In water with low alkalinity and little calcium, the shrimp's ability to absorb calcium from the phosphate source should be taken into account.
On conflicts of interest: 6 of the 13 authors work in the research and development department of Global Feed (Spain), the company that supplied the SCP-2% and MSP sources for the trial. The original paper discloses this clearly; the authors declare no commercial or financial relationships that could be considered a conflict of interest. Farmers should read the results with this in mind.
Source
Candela-Maldonado, Y. et al. (2025). Utilisation of Inorganic Phosphates in Standard Diets for Whiteleg Shrimp Litopenaeus vannamei (Boone, 1931). Animals, 15(19), 2769. Published September 23, 2025. https://doi.org/10.3390/ani15192769. The original paper is open access under a CC BY 4.0 license; Figures 1, 2 and 4 are taken from the original paper. The tables in this article show only selected data; full error values and statistical notation are in the original paper.