Summary for farmers
- An 8-week tank trial: cutting fishmeal from 20% to 10% made whiteleg shrimp eat less and grow more slowly.
- Adding 2% protein hydrolysate made from crayfish by-products: shrimp ate more, weighed 8.83 g versus 8.06 g, and had a feed conversion ratio of 1.28 versus 1.33 – on par with the control.
- Two hepatopancreas enzymes went down; appetite-related genes and gut bacteria also changed.
- Survival did not differ. Only one level, 2%, has been tested, in tanks, at a salinity of 8–10‰.

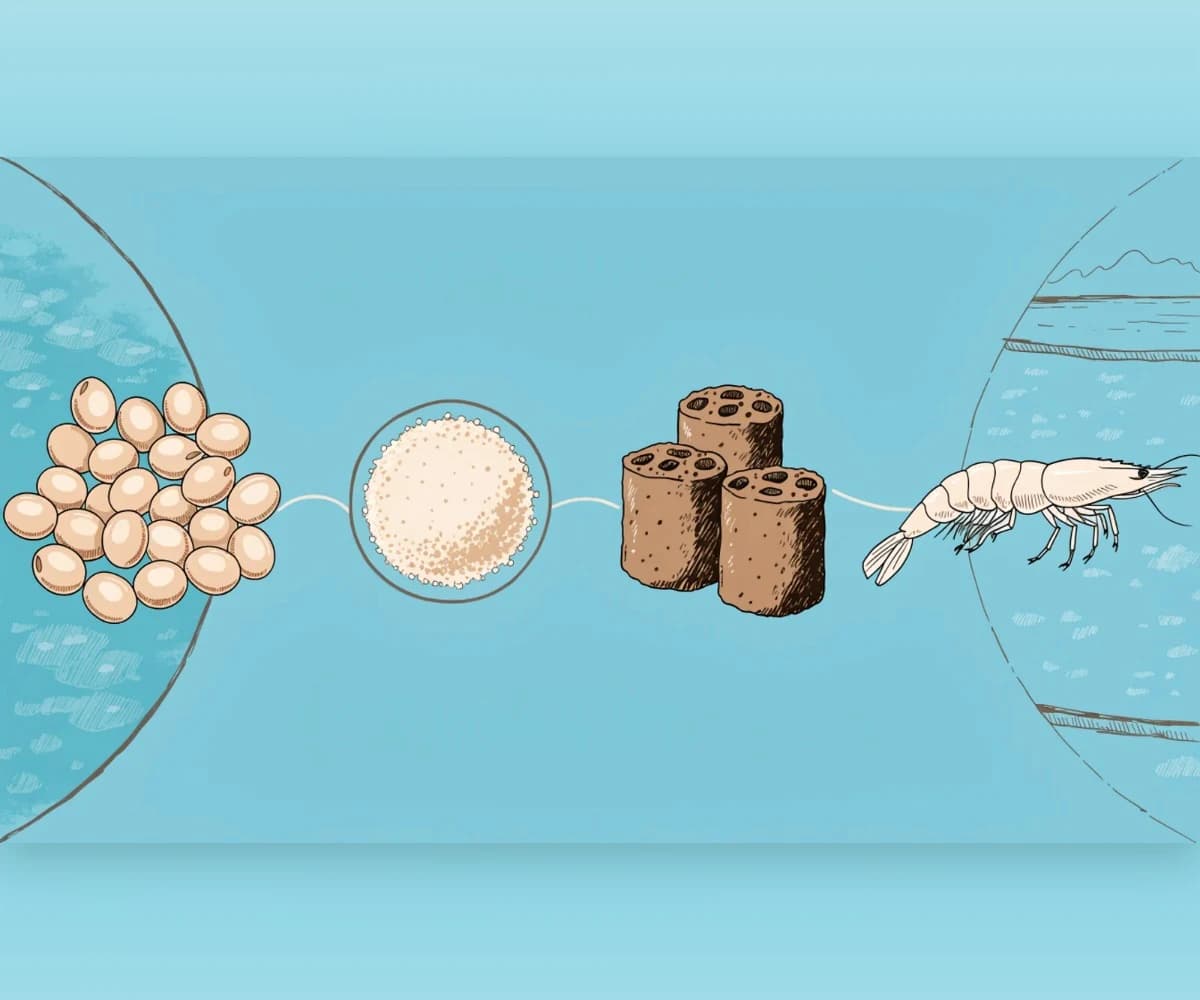
Shrimp feeds contain less and less fishmeal because prices are volatile and supply is uncertain. The fishmeal taken out is usually replaced with plant protein such as soybean meal. According to the paper, replacing a large share can easily make shrimp eat less and grow more slowly. A research team at Nanjing Agricultural University (China) tested adding protein hydrolysate to low-fishmeal feed for whiteleg shrimp. The paper was published in the journal Metabolites on March 27, 2026.
1. What is crayfish by-product protein hydrolysate?
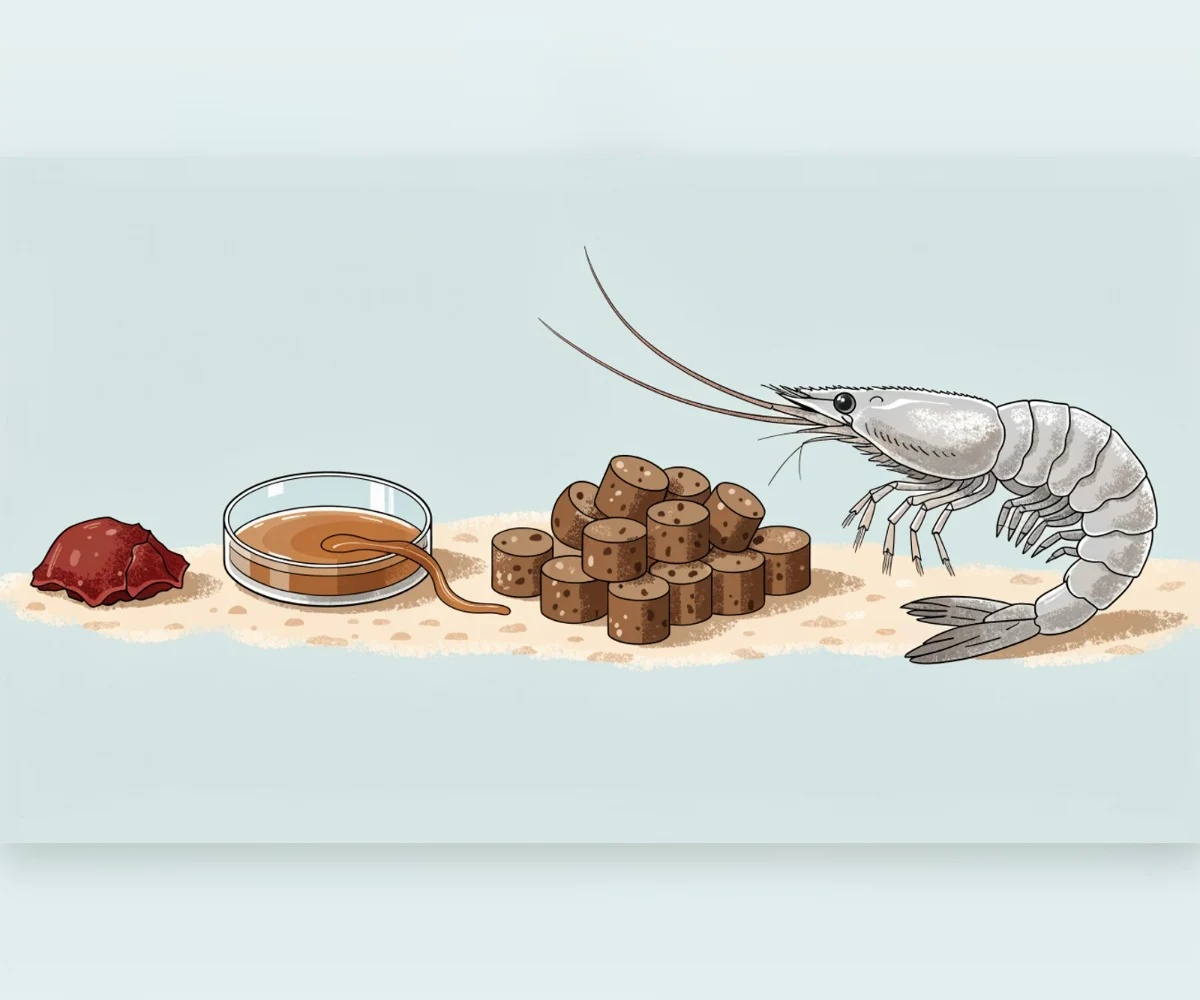
Crayfish (Procambarus clarkii) are farmed widely in China. The heads, claws and shells make up about 70% of the animal's weight and are by-products. The authors used enzymes to hydrolyze these by-products, producing crayfish by-product protein hydrolysate (CBPH). According to the paper, protein hydrolysates are rich in short peptides and free amino acids and dissolve easily, which helps shrimp recognize the feed and eat more.
The authors made this ingredient themselves. The paper does not state the type of enzyme, the hydrolysis method or the ingredient's nutrient composition, so the results apply only to this specific ingredient.
The 2% level was chosen based on earlier formulation trials. The study only compared diets with and without the hydrolysate at this level; it did not test several doses to find the best level.
2. The three diets and rearing conditions
The three diets had similar protein and lipid levels: a control diet (20% fishmeal), a low-fishmeal diet (10%) and a low-fishmeal diet with 2% added protein hydrolysate (the hydrolysate group, for short). The fishmeal taken out was made up mainly with soy protein (see table). The third diet simply had 2% less wheat flour to make room for 2% protein hydrolysate.
| Item | Control | Low fishmeal | Low fishmeal + hydrolysate |
|---|---|---|---|
| Fishmeal | 20 | 10 | 10 |
| Soybean meal | 23 | 27 | 27 |
| Soy protein concentrate | 3 | 9 | 9 |
| Wheat flour | 24.67 | 24.05 | 22.05 |
| Protein hydrolysate | 0 | 0 | 2 |
| Crude protein (analyzed) | 39.53 | 39.16 | 39.27 |
| Crude lipid (analyzed) | 7.61 | 7.34 | 7.45 |
A total of 360 healthy juvenile shrimp, averaging 0.46 g, were randomly assigned to 12 composite tanks of 300 liters, with 4 tanks per diet. The shrimp were fed to satiation 3 times a day (8:00, 14:00 and 20:00) for 8 weeks. Uneaten feed was siphoned out after 1 hour to calculate feed intake.
Water was kept at 28–30°C, with a salinity of 8–10‰, pH 7.8–8.0 and dissolved oxygen above 7 mg/liter.
3. Shrimp ate more, and growth came back to the control level
| Parameter | Control | Low fishmeal | Low fishmeal + hydrolysate |
|---|---|---|---|
| Final weight (g/shrimp) | 9.02 ± 0.28 | 8.06 ± 0.32 | 8.83 ± 0.25 |
| Feed intake (g/shrimp) | 10.71 ± 0.21 | 10.06 ± 0.25 | 10.69 ± 0.20 |
| Feed conversion ratio | 1.25 ± 0.02 | 1.33 ± 0.03 | 1.28 ± 0.02 |
| Survival (%) | 96.67 ± 3.85 | 91.67 ± 4.30 | 90.83 ± 3.19 |
Cutting fishmeal from 20% to 10% made shrimp eat less, grow more slowly and use feed less efficiently (8.06 g versus 9.02 g in the control).
With 2% protein hydrolysate added, shrimp ate more and reached 8.83 g, about 10% heavier than the low-fishmeal group. The feed conversion ratio (FCR) fell from 1.33 to 1.28. These differences were statistically significant.
On these measures, the hydrolysate group did not differ from the control. In other words, the hydrolysate made up for the losses caused by cutting fishmeal, but has not been shown to be better than the control diet.
Survival, condition factor and the hepatopancreas-to-body weight ratio did not differ significantly among the three groups, so it cannot yet be said that the hydrolysate helped more shrimp survive.
4. The shrimp body and blood
Whole-body protein and lipid were lower in the low-fishmeal group than in the other two groups. Whole-body protein (on a wet-weight basis) was 16.98% in the control, 16.36% in the low-fishmeal group and 17.00% in the hydrolysate group.
In the shrimp blood, the low-fishmeal group had the highest levels of two hepatopancreas enzymes commonly used to assess damage (AST, ALT) (303.75 and 252.75 U/L). The hydrolysate group had the lowest levels (209.00 and 178.75 U/L), lower even than the control.
Compared with the low-fishmeal group, the hydrolysate group had higher total blood protein and lower blood glucose (1.66 versus 2.28 mmol/L). Blood lipids did not differ.
The authors suggest that low-fishmeal feed puts pressure on metabolism and the hepatopancreas, and that the hydrolysate eased that pressure. These are blood indicators, not disease tests; the study did not examine hepatopancreas tissue and did not run a pathogen challenge.
5. Appetite-related genes in the gut
The authors measured five appetite-related genes in the shrimp gut. Compared with the control, the low-fishmeal feed raised three appetite-suppressing genes and lowered one appetite-stimulating gene. Adding the hydrolysate did the opposite, compared with the low-fishmeal group. The fifth gene, linked to satiety, did not differ among the three groups.
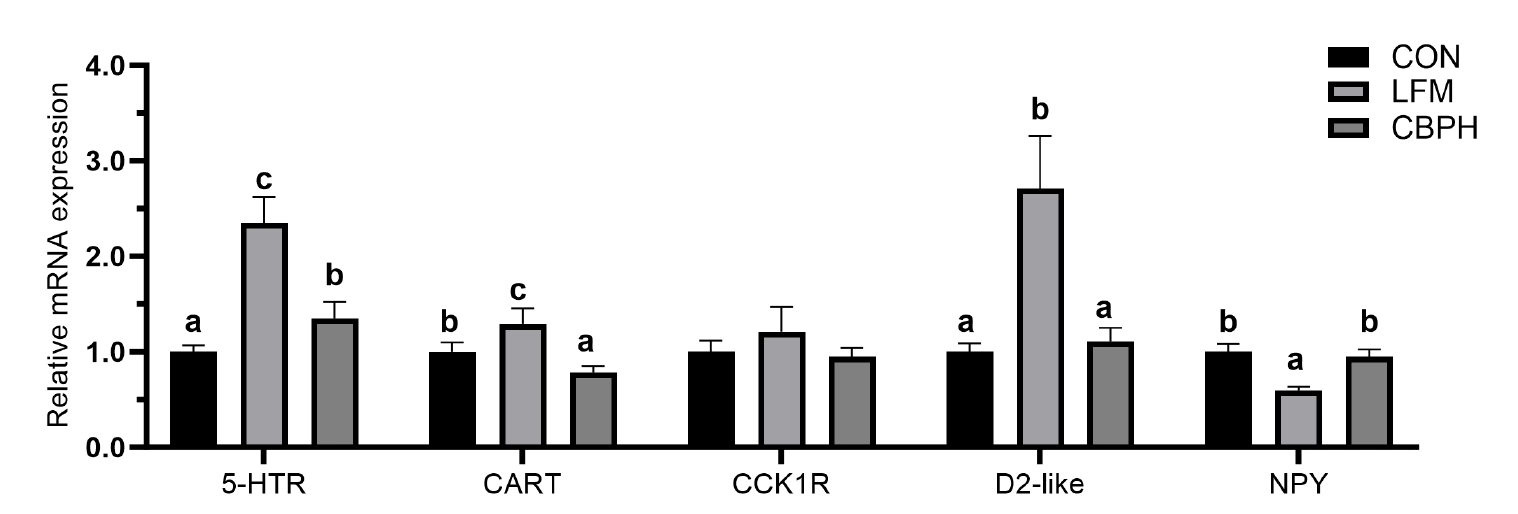
The authors see this as a basis for explaining why the shrimp ate more; these are only measurements of gene expression, which merely suggest a mechanism.
6. Gut microbiota
Gut bacteria were identified by gene sequencing (16S rRNA). Results were calculated with two estimators of the number of bacterial types (ACE, Chao1) and two diversity indices (Shannon, Simpson).
| Parameter | Control | Low fishmeal | Low fishmeal + hydrolysate |
|---|---|---|---|
| Number of bacterial types (estimate 1) | 326.52 | 283.66 | 398.68 |
| Number of bacterial types (estimate 2) | 332.06 | 284.14 | 400.11 |
| Diversity (index 1) | 5.87 | 4.62 | 4.63 |
| Diversity (index 2) | 0.97 | 0.92 | 0.91 |
The number of bacterial types was higher in the hydrolysate group than in the low-fishmeal group; the control did not differ significantly from either group. Diversity, on the other hand, was the same in the two low-fishmeal groups (with and without hydrolysate), and both were lower than the control. In other words, the hydrolysate increased the number of bacterial types but did not bring diversity back to the control level.
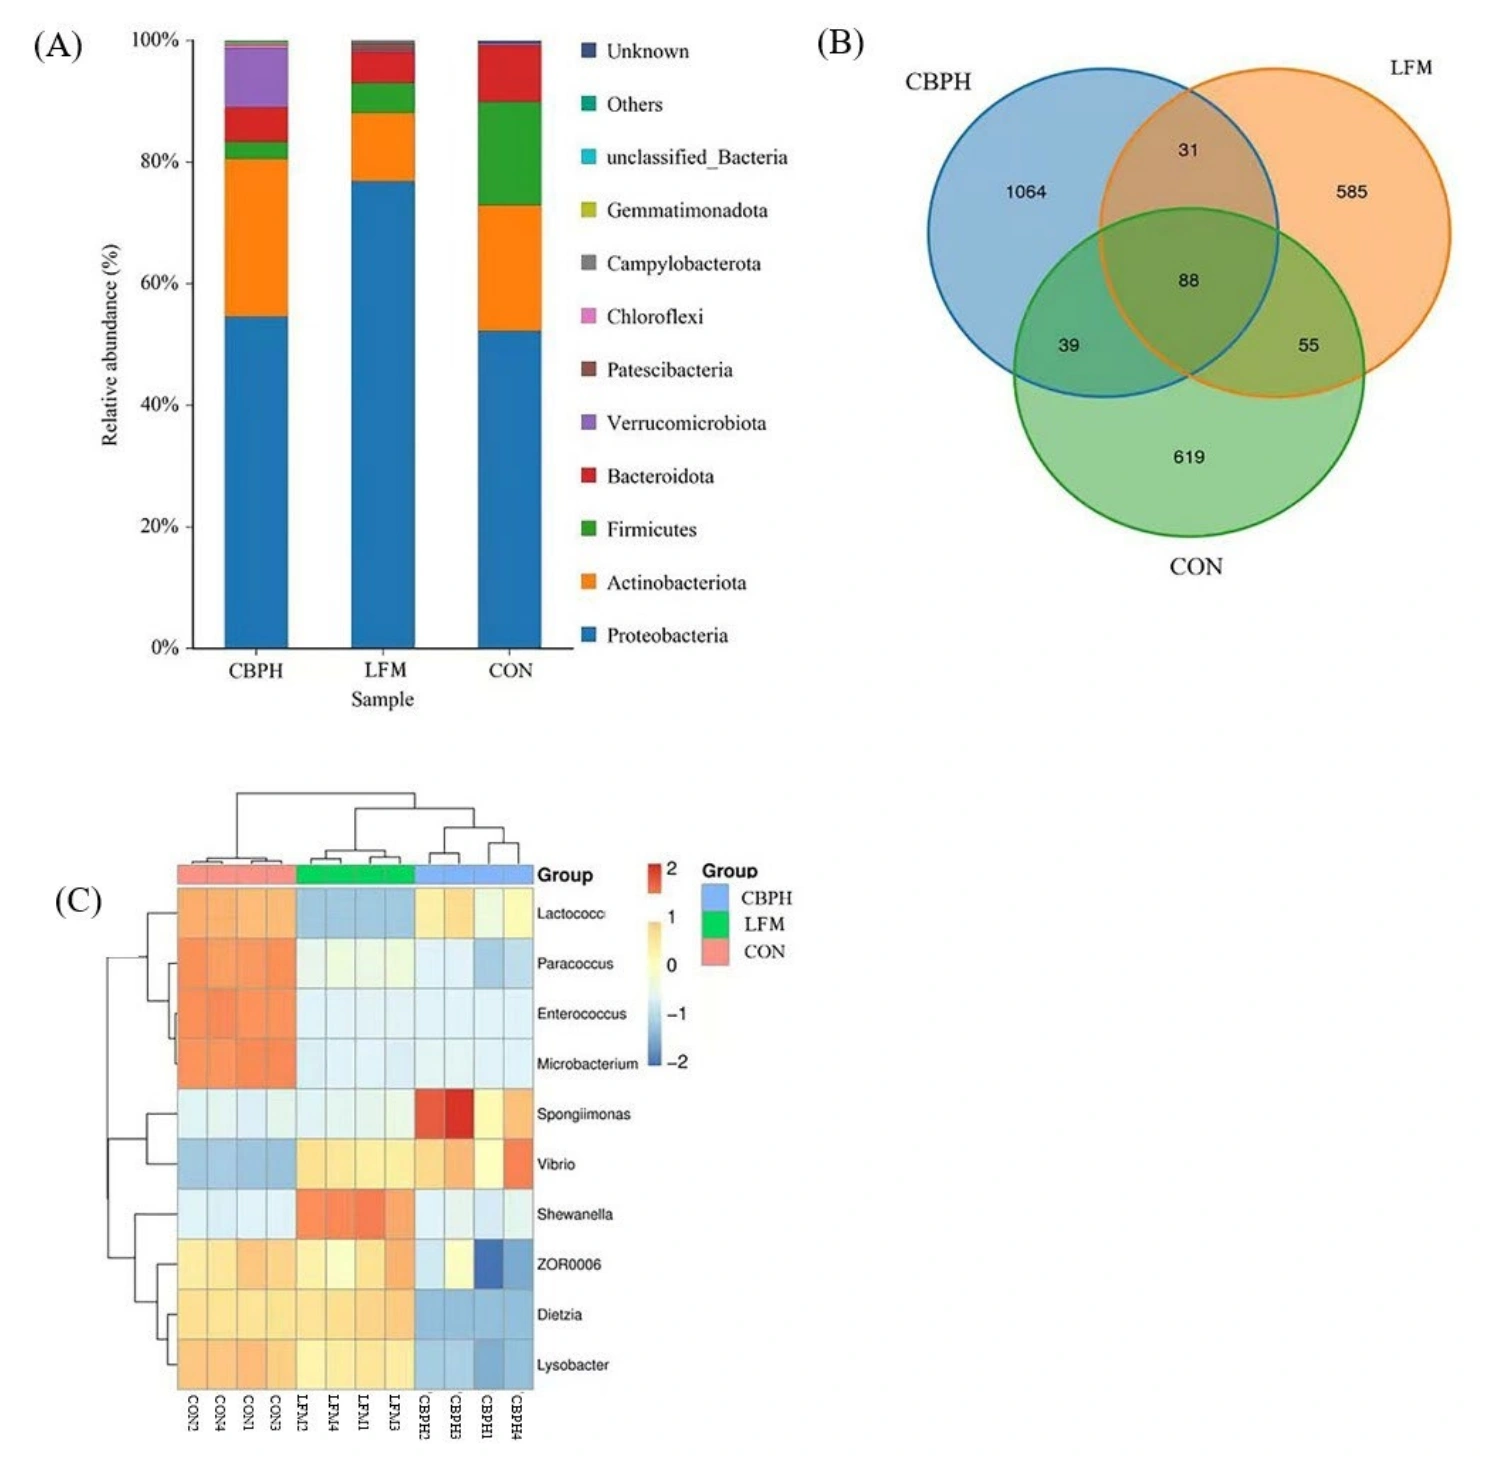
The authors themselves note a limitation: the role of these bacterial changes in the shrimp has not been directly verified.
7. What farmers should keep in mind
The study tested only one level, 2%, of one in-house protein hydrolysate, for 8 weeks in tanks. There is no optimal dose yet, no economic assessment, and no testing in ponds or at other salinities.
The 2% level means 20 g of protein hydrolysate in each kg of feed, already built into the formula in place of 2% wheat flour. This is not a guide to mixing an extra 20 g of any product into each kg of the feed you are using.
When switching to a low-fishmeal feed, farmers should closely watch the shrimp's feed intake and growth rate. If you choose a feed with protein hydrolysate, ask clearly about the raw material source and the trial results for that specific feed.
The authors declare that they received no specific funding and have no conflicts of interest.
Full-text source
Ren, L., Gu, W., Sun, H., Fan, G. and Yang, X. (2026). Low-Fishmeal Dietary Supplementation with Crayfish By-Product Protein Hydrolysate Affects Growth Performance, Appetite-Related Metabolic Signaling and Intestinal Microbiota of Pacific White Shrimp (Litopenaeus vannamei). Metabolites, 16(4), 221. Published March 27, 2026. Original paper · Full-text PDF in English. Content and figures used under CC BY 4.0.