Summary for farmers
- Replacing regular soybean meal with the low-oligosaccharide or the enzyme-treated type: in neither trial did whiteleg shrimp grow more slowly than the control.
- Green-water tanks, 8 weeks: shrimp reached 19.46–20.87 g each, with all nine diets performing alike.
- Clear-water tanks, 5 weeks: with 60–80% replacement by the low-oligosaccharide type, shrimp reached 8.44–8.45 g, versus 7.49 g for the control. Full 100% replacement gave no further growth.
- Shrimp fed the enzyme-treated type had more diverse gut bacteria than shrimp fed the low-oligosaccharide type, but this does not prove the shrimp were healthier.

How do whiteleg shrimp grow when regular soybean meal is swapped for improved soybean meals? A team led by Aakriti Khanal at Auburn University (USA) published two trials on this question on July 2, 2026. They tracked growth, feed conversion, protein and phosphorus retention, and the gut bacteria of whiteleg shrimp.
1. Three soybean meals, nine diets
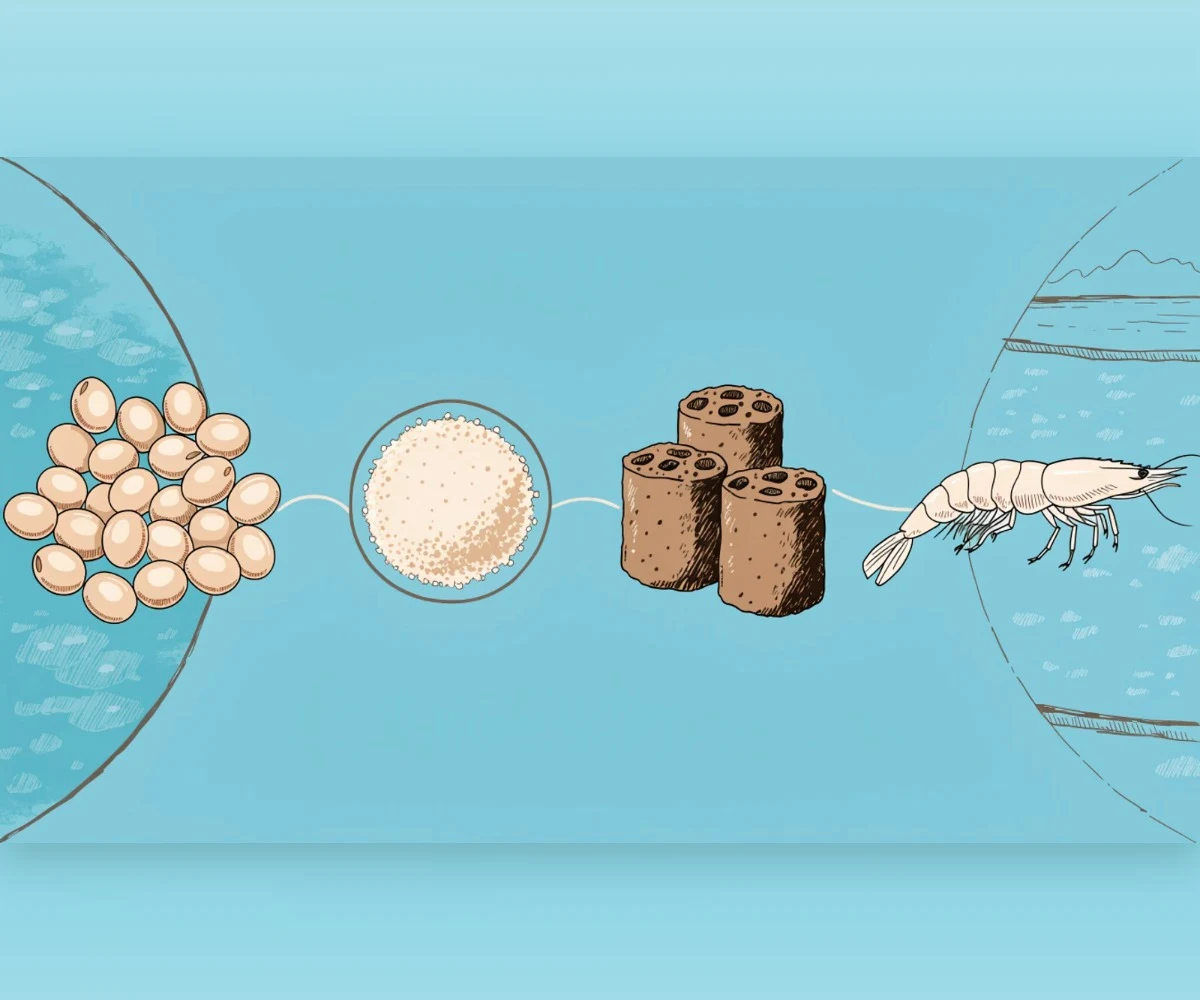
The control diet used regular soybean meal (SBM), the solvent-extracted type, as its main protein source. The two alternatives were low-oligosaccharide soybean meal (LO-SBM), made from selected soybean varieties, and enzyme-treated soybean meal (ET-SBM), meaning soybean meal that has been processed with enzymes.
Each alternative replaced regular soybean meal at four levels: 40, 60, 80 and 100%. Together with the control, that makes nine diets. As formulated, every diet contained the same 35% protein and 8% lipid. The control diet contained 6% fishmeal, 49.63% regular soybean meal and 7.5% corn protein concentrate.
Replacement levels are calculated on a protein basis, not as inclusion rates in the feed. The two improved meals are richer in protein, so less of them is needed. At 100% replacement, LO-SBM made up 41.60% of the feed and ET-SBM 41.05%, in place of 49.63% regular soybean meal.
| Meal | Crude protein (%) |
|---|---|
| Regular (SBM) | 43.28 |
| Low-oligosaccharide (LO-SBM) | 53.36 |
| Enzyme-treated (ET-SBM) | 61.56 |
2. Two tank systems
- Outdoor green-water tanks: 36 tanks of 800 liters, filled with water from a shrimp pond, with 5% exchanged each day to keep natural food in the water. Each tank held 30 shrimp (about 35 shrimp/m²); juveniles of 0.29 g were grown for 8 weeks and fed 4 times/day, with 4 tanks per diet.
- Indoor clear-water recirculating tanks: 44 glass tanks of 80 liters, 15 shrimp per tank (about 83 shrimp/m²), juveniles of 0.78 g, grown for 5 weeks, with 4–5 tanks per diet.
Because initial size, stocking density and culture period differed, shrimp weights are not compared between the two systems. Gut bacteria were analyzed only in the clear-water tanks, in three groups: the control, 100% replacement with LO-SBM and 100% replacement with ET-SBM. The gut samples were gene-sequenced to identify the bacteria.
3. Green-water tanks: all nine diets gave similar results
After 8 weeks, shrimp reached 19.46–20.87 g each. Weight, feed conversion ratio (FCR) and the share of protein retained in the shrimp body did not differ clearly among the nine diets. FCR ranged only from 1.00 to 1.10. (In this article, a “clear difference” means a statistically significant one.)
Among the production indicators, the only clear difference was phosphorus retention: 80% replacement with LO-SBM reached 29.30%, higher than the control at 25.35%.
Survival was 96.67% or higher. Two groups recorded 100.83%, above 100%; the authors suggest that shrimp from neighboring tanks may have slipped in. Survival in these tanks should therefore be taken as indicative only.
4. Clear-water tanks: 60–80% replacement with LO-SBM gave larger shrimp
| Diet | Final weight (g/shrimp) | FCR | Phosphorus retention (%) |
|---|---|---|---|
| Control | 7.49 | 1.50 | 10.51 |
| LO-SBM 40% | 7.99 | 1.29 | 10.39 |
| LO-SBM 60% | 8.44 | 1.48 | 11.49 |
| LO-SBM 80% | 8.45 | 1.46 | 14.02 |
| LO-SBM 100% | 8.01 | 1.44 | 10.09 |
| ET-SBM 40% | 7.72 | 1.48 | 10.59 |
| ET-SBM 60% | 7.14 | 1.50 | 8.41 |
| ET-SBM 80% | 7.24 | 1.47 | 9.11 |
| ET-SBM 100% | 7.92 | 1.60 | 10.96 |
With 60% and 80% replacement by LO-SBM, shrimp reached 8.44–8.45 g, clearly larger than the control at 7.49 g. Full 100% replacement (8.01 g) brought no added benefit and did not differ clearly from the control.
FCR was lowest at the 40% level (1.29), but the differences among diets were not statistically conclusive. Phosphorus retention was highest at the 80% level (14.02%): clearly different from the 100% level (10.09%), but not clearly different from the control (10.51%).
With ET-SBM, 100% replacement gave shrimp of 7.92 g, clearly larger than the control (7.49 g) and the 60–80% levels (7.14–7.24 g). The response did not rise steadily with the replacement level. FCR and phosphorus retention in this group did not differ clearly between levels.
Survival in the clear-water tanks ranged from 73.33% to 89.33%, with no clear difference between diets.
5. Gut bacteria
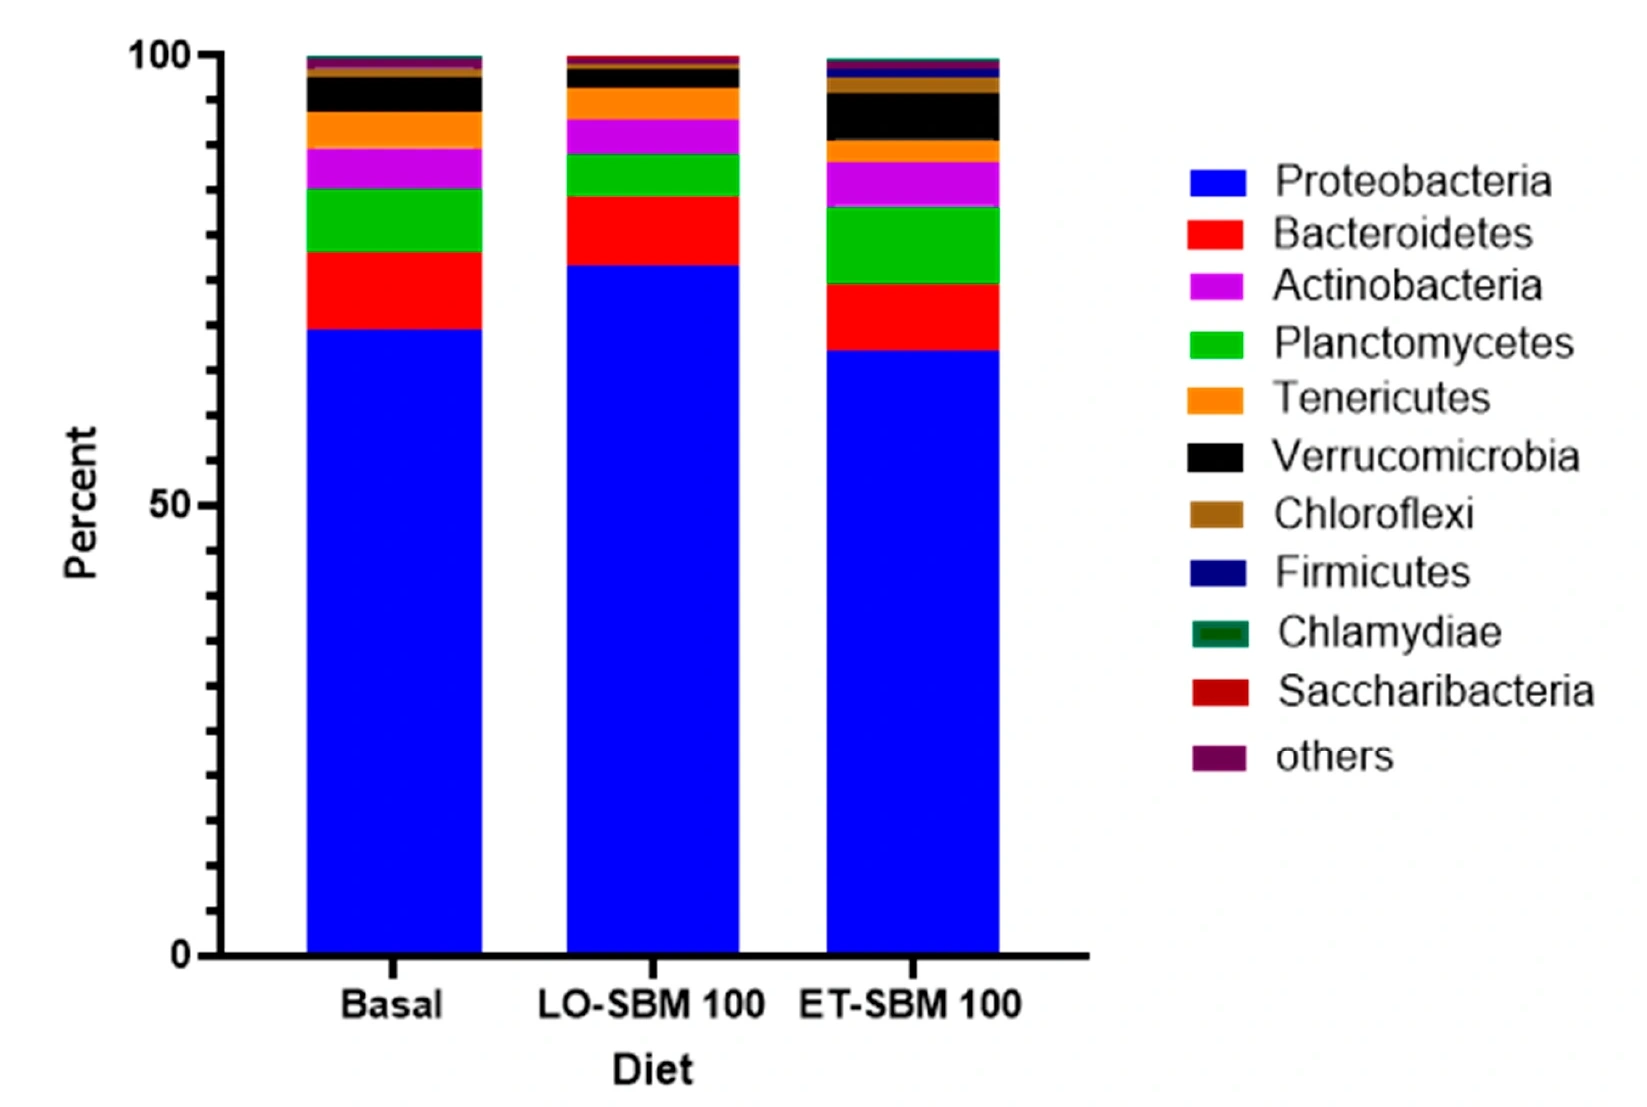
In all three groups, the most abundant bacteria belonged to the phylum Proteobacteria: 69.49% in the control, 76.58% in the 100% LO-SBM group and 67.26% in the 100% ET-SBM group. Bacterial composition did not differ clearly among the three groups. This is the share of an entire large bacterial phylum, which is typically the most abundant in the gut of many shrimp species, not the share of pathogenic bacteria.
| Group | Diversity index (higher = more diverse) | Number of bacterial types observed |
|---|---|---|
| Control | 5.34 | 296.71 |
| LO-SBM 100% | 4.59 | 242.69 |
| ET-SBM 100% | 5.45 | 326.41 |
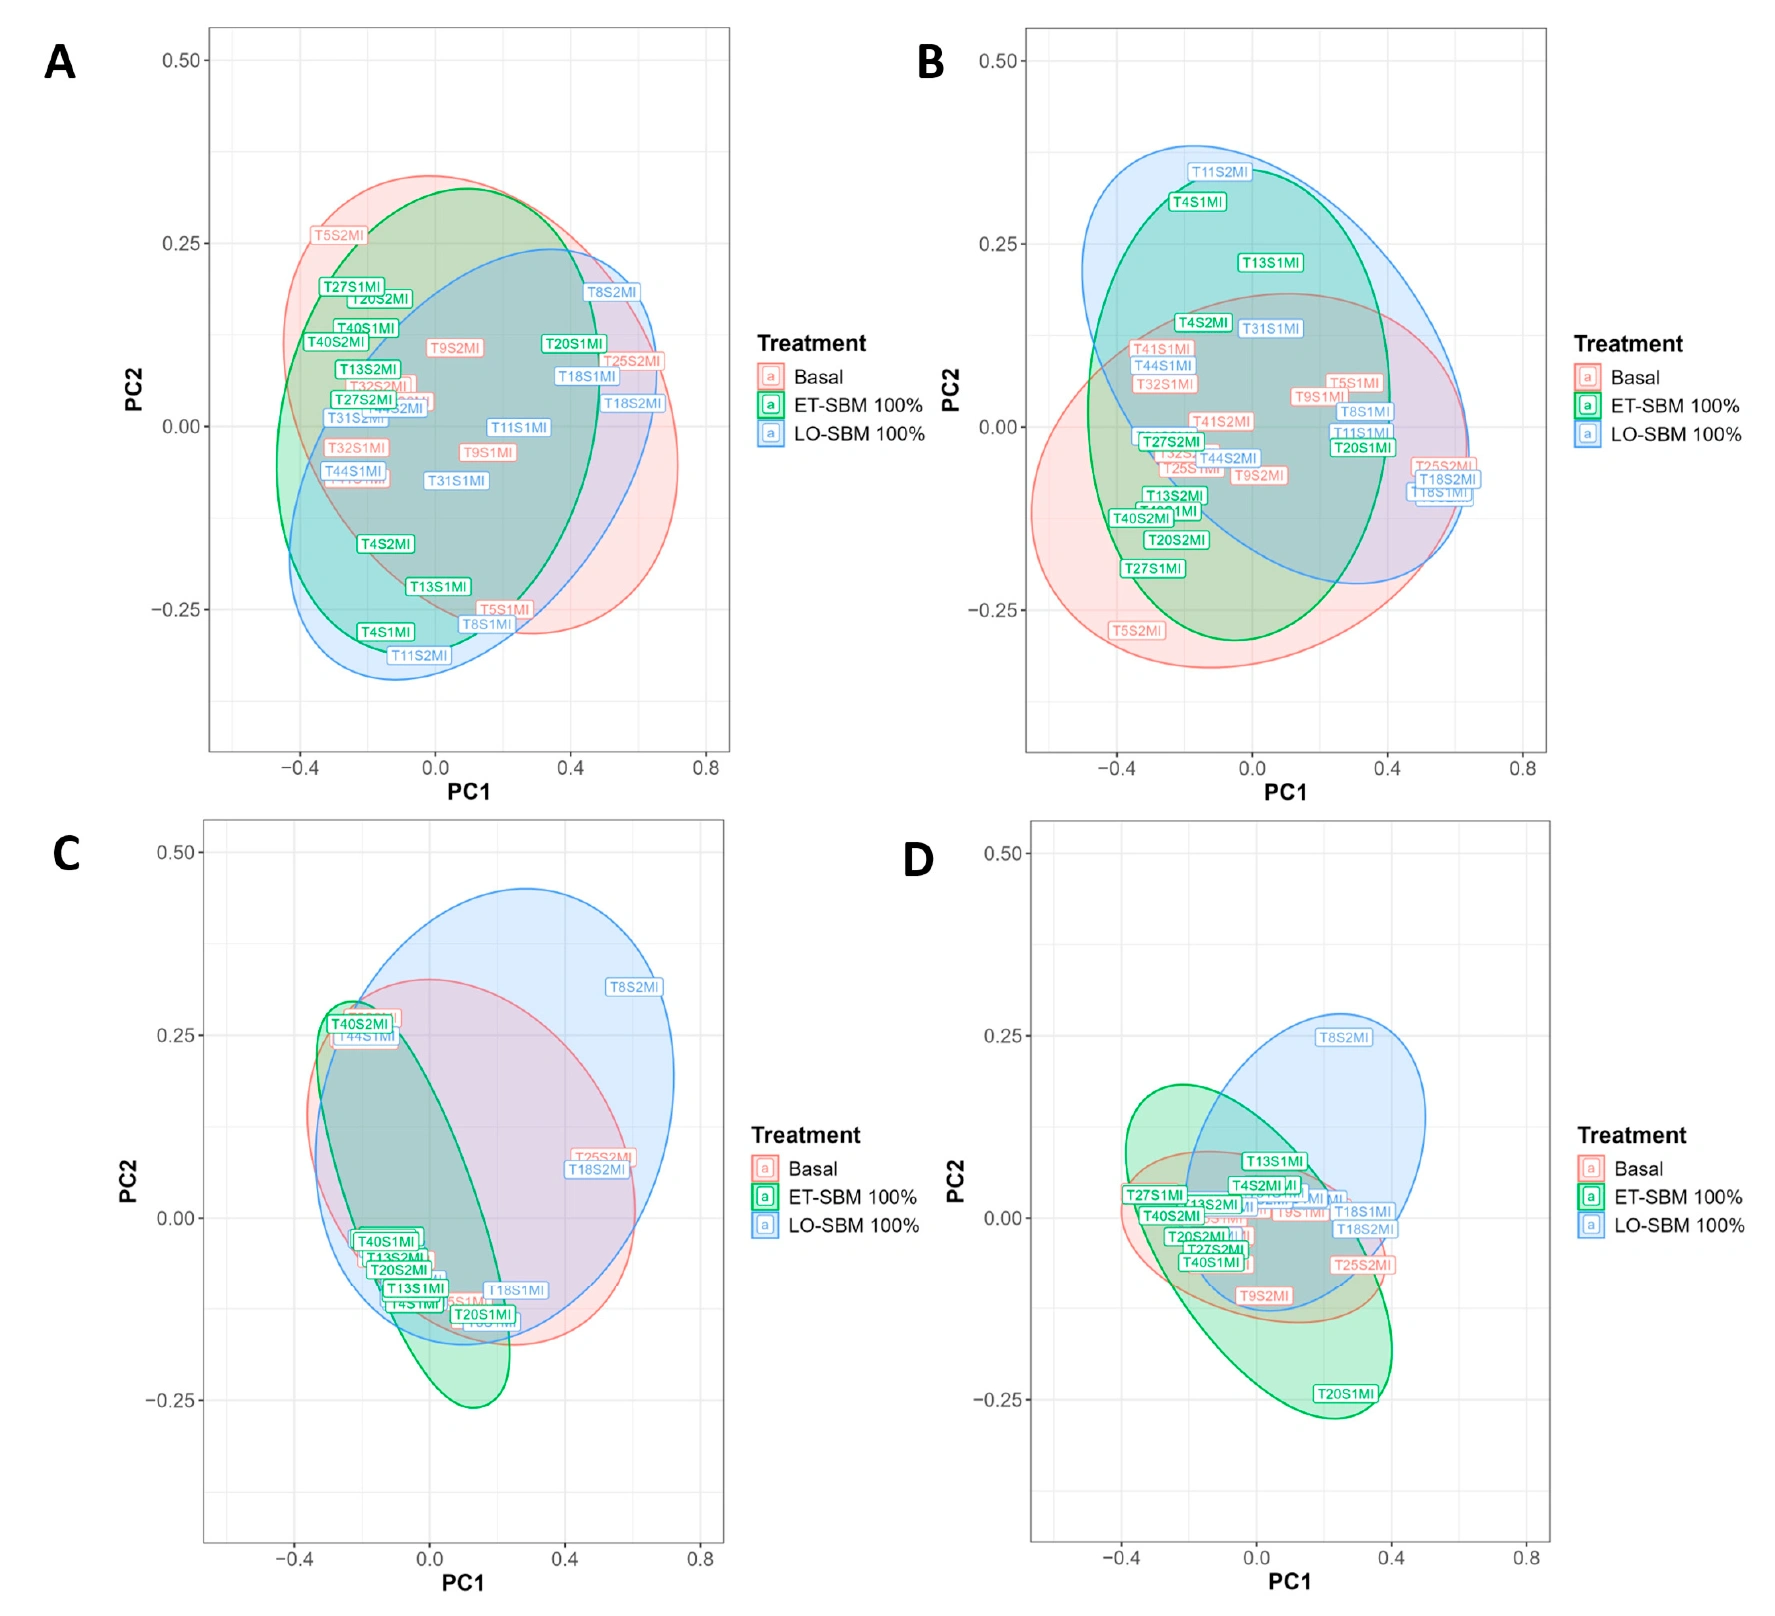
Shrimp fed ET-SBM had clearly more diverse gut bacteria, with clearly more bacterial types, than shrimp fed LO-SBM. The LO-SBM group was lowest on both indices. However, when the overall bacterial composition of the three groups was compared (beta diversity, Figure 2), the differences were not statistically significant.
6. How to read the results correctly
- The authors conclude that, under the trial conditions, replacing regular soybean meal with these two meals did not harm the shrimp. All diets were balanced for essential amino acids, especially lysine and methionine.
- Differences in weight were seen only in the clear-water tanks. In the green-water tanks, shrimp grew equally well on all diets.
- Gut bacteria were measured only at the 100% replacement level, in the clear-water tanks. The study did not challenge the shrimp with a pathogen, so it cannot yet be said that more diverse gut bacteria mean healthier shrimp or better disease resistance.
- These were tank trials of 5–8 weeks, not a full crop in a pond.
Source
Khanal, A. et al. (2026). Effects of Different Soybean Protein Sources on Growth Performance, Feed Utilization Efficiency, and Gut Microbiota of Pacific White Shrimp (Litopenaeus vannamei) in Green Water and Clear Water Systems. Aquaculture Journal, 6(3), 25. Published July 2, 2026. DOI: 10.3390/aquacj6030025 · Full-text PDF (English). The paper and figures are used under a CC BY 4.0 license. The study was funded in part by the Alabama Agricultural Station, the Hatch program of the U.S. Department of Agriculture and the United Soybean Board; the authors declare no conflicts of interest.