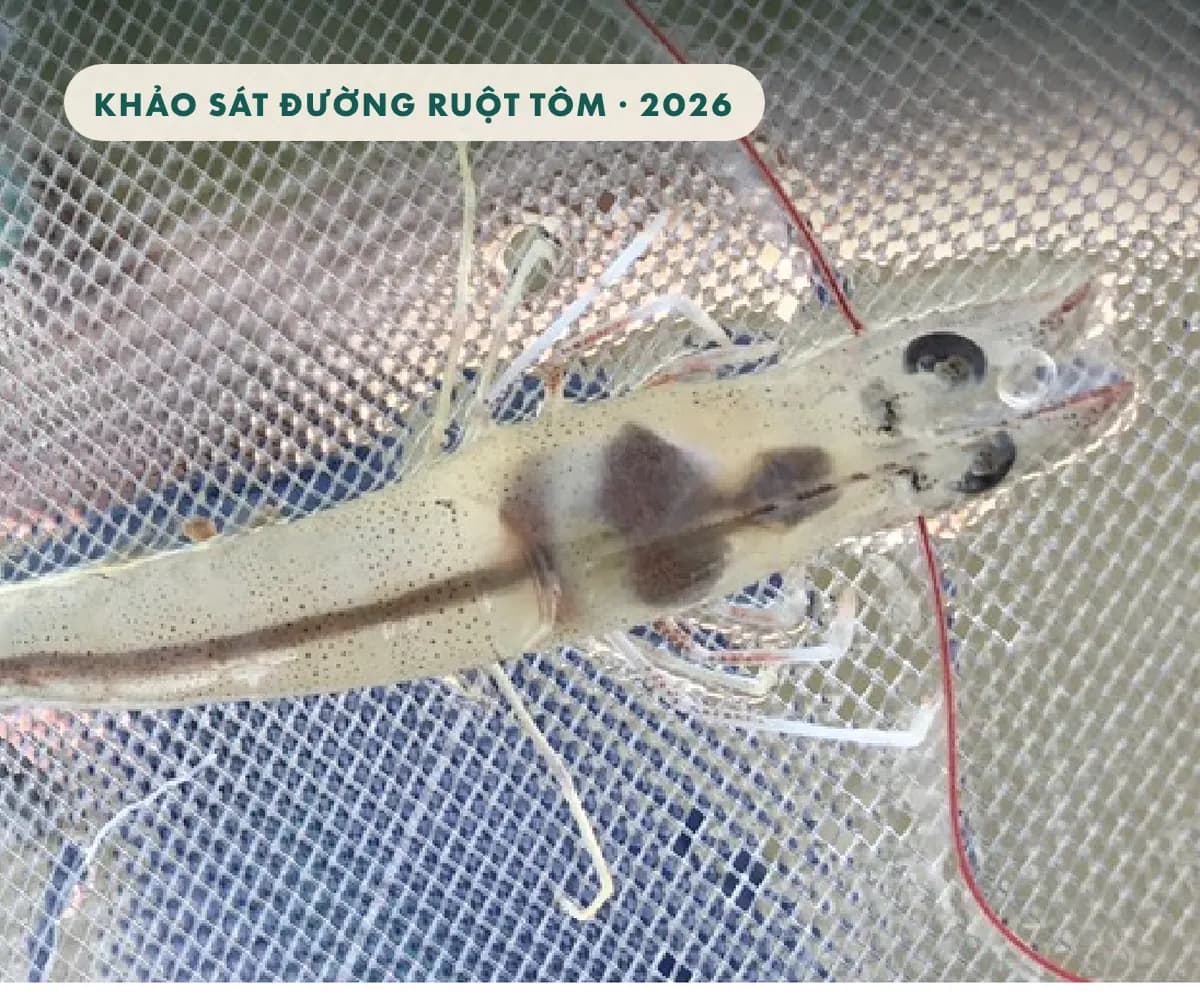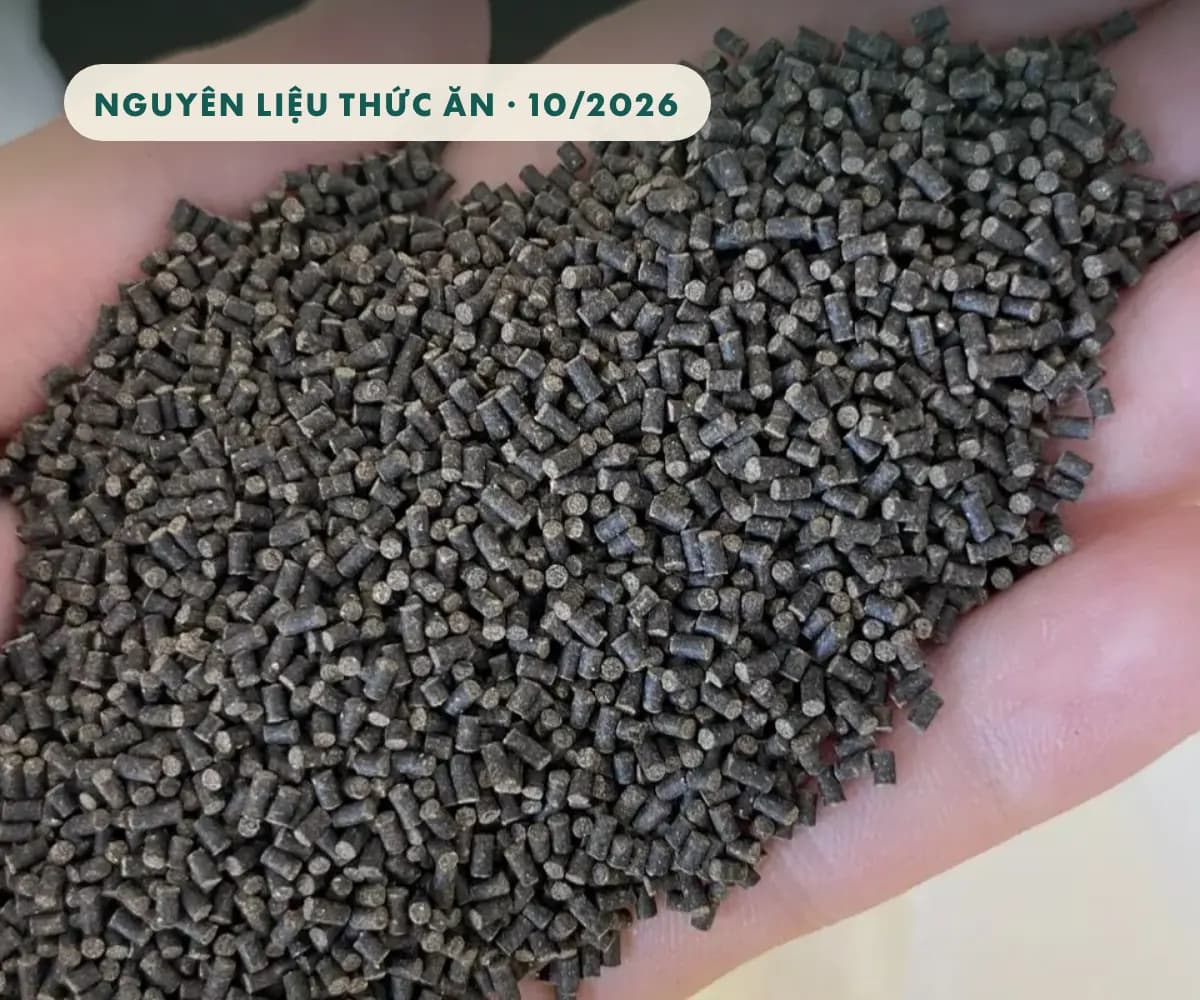
Every time you want to know the shrimp's size or growth rate, you have to lift them up, weigh and measure, then release them back. Not only is this laborious, but it also stresses the shrimp, and you can only assess a small portion of the pond. A Portuguese research group has tried a different approach: attaching a small camera above the feeder, letting AI software observe and calculate automatically. The initial results are quite surprising.
Source: Correia B., Pacheco O., Rocha R.J.M., Correia P.L. (2025). Image-Based Shrimp Aquaculture Monitoring. Journal Sensors, 25(1), 248. DOI: 10.3390/s25010248. The study was conducted on whiteleg shrimp Penaeus vannamei at the RiaSearch research center (Portugal). This article is translated and adapted by Thần Vương for Vietnamese shrimp farmers.
Why is this worth paying attention to?
Feed accounts for 40% to 65% of total production costs in shrimp farming. However, determining the right amount of feed, whether shrimp are feeding properly, and their current size mostly rely on experience-based observations of the feeder and periodic lifting of shrimp.
The manual method has three well-known weaknesses among farmers: it's time-consuming, only a tiny fraction of the pond can be sampled, and each lifting causes stress to the shrimp. Moreover, underfeeding or during molting, shrimp may cannibalize each other — often detected too late.
Equipment Used by the Research Group
In the experimental model of the article, the research group used the following configuration. This is research equipment, not a configuration proposed by Thần Vương for commercial deployment in shrimp ponds:
A mini computer Raspberry Pi (palm-sized, priced around a few million VND)
A wide-angle Raspberry Pi Camera Module 3 WIDE
Camera placed 94.5 cm above the feeder, with feeder dimensions 32 × 25.9 cm
A button to capture images at feeding time
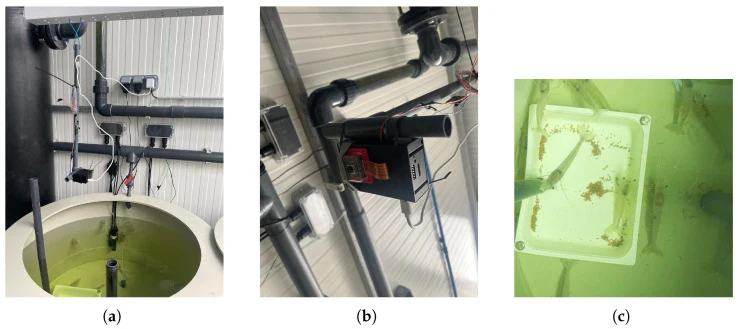
Figure 1. Complete system setup: (a) overall view of the camera rig on the culture tank; (b) cluster of Raspberry Pi computer and camera; (c) an image captured by the system. Source: Correia et al., Sensors 2025 (CC BY 4.0).
Notable point: the team attempted to place a camera in a mica box to counteract water reflection, but the mica surface caused the camera to lose focus, resulting in blurry images. Ultimately, they discarded the mica box and instead adjusted the position of the feeding tray to minimize reflections. This is a practical lesson for anyone looking to set up a similar system.
Teaching AI to "see" shrimp in murky water
The team captured 1,144 images on multiple days, at various times, under natural light, with two different types of feed. They then manually labeled each shrimp in the images to train the YOLOv8 model — a popular object detection AI currently.
"Shrimp Morphology" Model — selecting only shrimp lying straight, suitable for accurate size measurement (excluding those that were bent)
"Pond Activity" Model — identifying all shrimp to count quantity, regardless of posture
Prior to this, the team had attempted traditional image processing techniques (Canny Edge, K-means, Watershed) but failed when shrimp overlapped — a common scenario on actual feeding trays.
Measuring Shrimp Length: Which Method is Most Accurate?
The team compared three measurement methods against 60 manually measured shrimp:
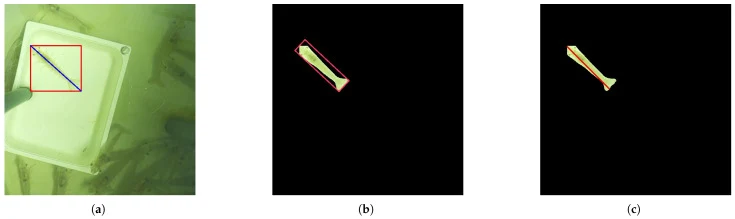
Figure 2. Three ways to measure shrimp length: (a) diagonal of bounding rectangle; (b) minimum bounding box — tightly around head and tail; (c) straight line detection using Hough transform. Source: Correia et al., Sensors 2025 (CC BY 4.0).
Measurement MethodAverage Error (MAPE)Absolute DeviationMinimum Bounding Box (MBBox) — tightly around head and tail1.56%0.23 cmHough Line — detecting straight line along body2.95%0.44 cmDiagonal of Bounding Rectangle10.87%1.58 cm
The Minimum Bounding Box (MBBox) method was clearly superior: with an error rate of only 1.56%, averaging a deviation of about 2 mm per shrimp. The diagonal measurement method yielded the poorest results due to its dependence on the shrimp's orientation within the frame.
Inferring Weight Without Scales
This is the most useful part for farmers. After measuring the length, the system measures the body width of the shrimp at a point approximately 31% of the body length from the head tip — specifically the thoracic region, characterized by the distinctive dark patch of whiteleg shrimp.
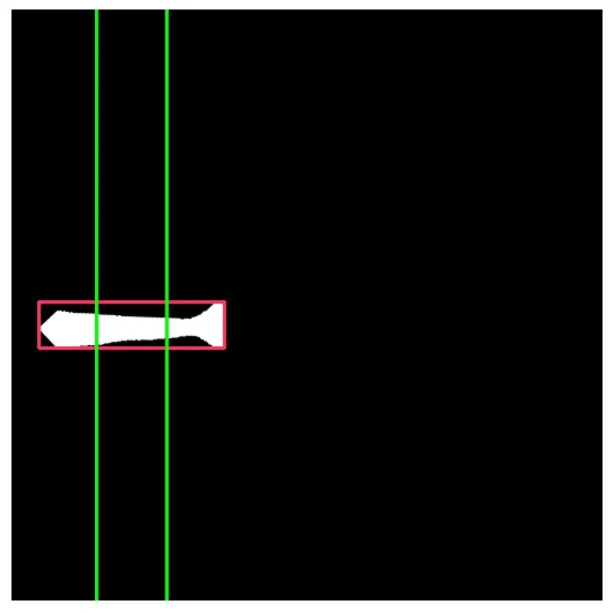
Fig. 3. Measuring width: software draws a cross-section at 31% of the body length from both ends of the frame, taking the longer line as the measurement. Source: Correia et al., Sensors 2025 (CC BY 4.0).
The error margin for width measurement is 4.19% (deviation of 0.15 cm). From real measurements of 186 shrimp, the team developed a regression formula linking length + width to weight.
Practical Implications
Estimate shrimp size without netting or lifting them out of the pond
No stress for shrimp, no disruption of feeding rhythm
Continuous daily weight gain monitoring instead of periodic checks per cycle
Replaces traditional methods requiring sampling up to 30% of the population
Counting Shrimp on Feeders: Error Less Than 1 Shrimp
With a confidence threshold of 0.60, the shrimp identification model achieves 94.3% accuracy and 93.5% coverage. The count error averages 0.97 shrimp compared to manual counting — typically less than one shrimp. The average percentage error is 7.17%.
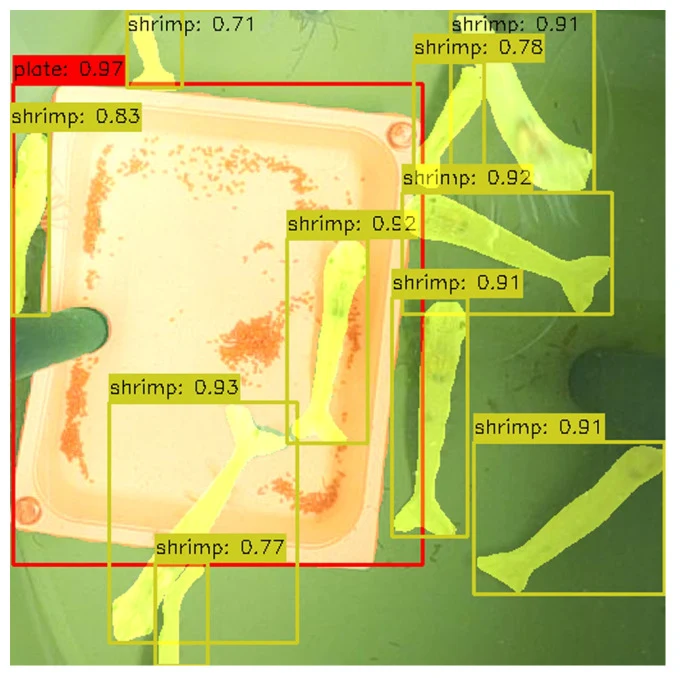
Fig. 4. AI outlines each shrimp on the feeder for counting — red border for feeder, yellow for shrimp. Source: Correia et al., Sensors 2025 (CC BY 4.0).
The research team openly discusses limitations: in cases with turbid water or poor lighting, errors jump to 9.23%. Additionally, shrimp often overlap or hide under the feeder's edge, complicating counts. Importantly, cameras currently only cover areas around feeders, not the entire pond.
Measuring "Feed Attractiveness" — The Most Interesting Part
The team experimented with two feed types: Type 1 using fishmeal (theoretically more attractive) and Type 2 using plant protein. They evaluated attractiveness in two ways:
Method 1: Monitoring Remaining Feed Pellets on the Feeder
The software measures the feeder area covered by feed pellets over time. Rapid area reduction = strong shrimp feeding. Actual observation confirms that fishmeal feed was almost entirely consumed, while plant protein feed still had leftover pellets on the feeder.
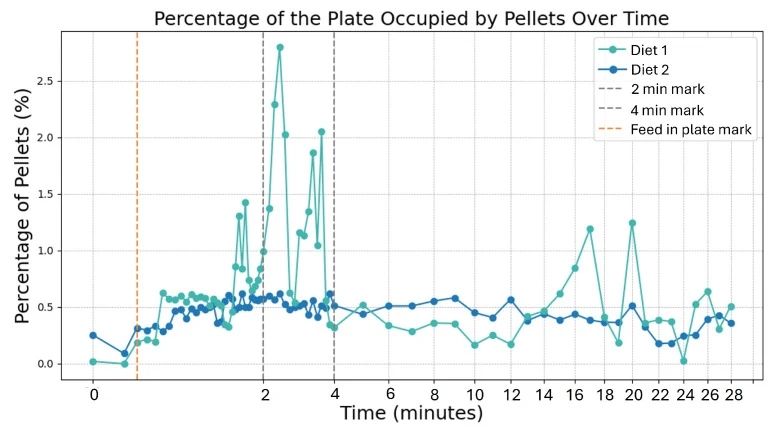
Figure 5. Feeder area covered by pellets over feeding time. Green line represents fishmeal feed (Type 1), blue line represents plant protein feed (Type 2). Source: Correia et al., Sensors 2025 (CC BY 4.0).
Method 2: Monitoring Shrimp Congregation Around the Feeder
With fishmeal feed, shrimp numbers around the feeder decreased by approximately 40% after about 5 minutes — indicating shrimp finished eating and left, a normal behavior. With plant protein feed, shrimp remained near the feeder but more feed was left — meaning shrimp approached but did not finish eating.
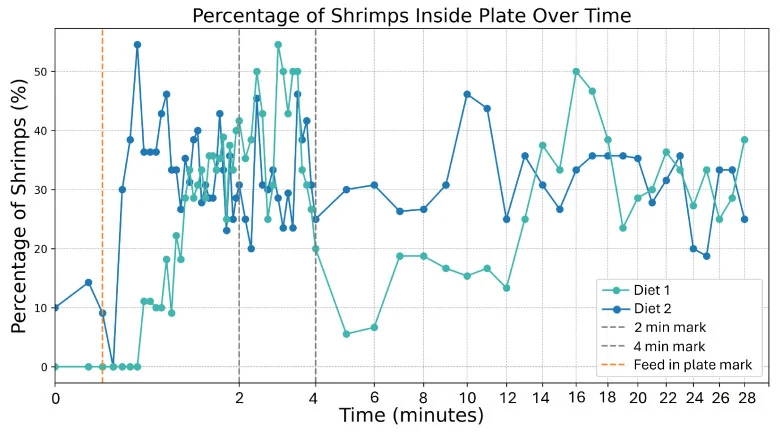
Figure 6. Shrimp congregation rates in the feeding area over time. Green line represents fishmeal feed (Type 1) — shrimp ate and left; blue line represents plant protein feed (Type 2) — shrimp lingered but feed remained. Source: Correia et al., Sensors 2025 (CC BY 4.0).
Important Note: The research group emphasizes that the new appetite assessment is currently at a qualitative level, not absolute precise numbers. Pellet counting is susceptible to light changes and shadows; shrimp counting is more stable but has the drawback that shrimp near the feeder may not necessarily be eating.
Current Capabilities of Nuoi Lời
On Thần Vương's nuoiloi.vn aquaculture diary software, the currently operational feature is shrimp counting via video snippets. Farmers lift and briefly record a clip; the software counts shrimp across multiple frames, suggests a number with confidence level, and alerts if frames significantly diverge. Pond owners review, correct if necessary, before logging — the system does not auto-log.
The system can also connect to underwater observation cameras placed at feeders, replacing manual video recording during each feeding session.
To clarify and avoid misunderstanding: the indices such as shrimp size, growth rate, or feeding time are what the study has proven cameras can do — not features currently provided by Nuôi Lời. The existing feature is counting shrimp in the trough, with the number displayed in the diary alongside feed quantity, environmental indicators, and the pond's disease history.
View at nuoiloi.vn, or discuss further with Thần Vương’s technical team — 0867 957 568.
What remains unaccomplished?
This is not a fully commercialized product. The authors list clear limitations and areas for improvement:
Cameras placed on the water surface suffer from reflections; submerging them in waterproof boxes improves image quality
Identifying feed pellets by color (HSV) is highly sensitive to lighting changes — deep learning models are needed instead
More image data, especially of shrimp lying straight, is required for a more accurate model
Human verification of measurement images is necessary to eliminate cases where rippling water distorts shapes
Commercial ponds often have stable artificial lighting — which would mitigate most errors due to lighting variability encountered in the study
Conclusion of the field survey: What can Thần Vương accomplish?
Brief Conclusion: AI camera technology on feed sifters can be deployed in Vietnam, but it must be viewed as a controlled sampling system — not a camera that can see through murky water or count all shrimp in the pond. The camera only counts and measures shrimp clearly visible within its observation area; from this sample, the software tracks trends in shrimp size, concentration around the sifter, and feeding time.
The 1.56% error rate in the study is a result of a controlled experimental setup, not a default accuracy level for all commercial ponds. More recent field research also shows that underwater length measurement can achieve an MAPE of approximately 3.16% and weight prediction around 10.58%, but this requires image distortion correction, size markers, and a mechanism to exclude murky frames. Therefore, all Thần Vương’s indices must be re-verified on actual Vietnamese pond conditions before using them to adjust feed rations.
Minimum Conditions for Stable System Operation
Fixed camera at correct height/angle, waterproof housing suitable and with a size reference plate on the same plane as the shrimp.
Stable diffused lighting; minimizing fan shadows, water surface reflections, air bubbles, and lens fouling.
Contrasting sieve background, standard size, and moderate observed shrimp number to reduce overlap.
Software for automatic image quality scoring; discarding blurry, shaky, overexposed frames or heavily overlapped shrimp instead of forcing a count.
AI data must be periodically cross-verified by manual sampling, weighing, and measuring. Farmers or technicians approve before logging the data.
Free using AI tool at : http://nuoiloi.vn
Do you need technical consulting for your aquaculture pond?
24/7 AI Consulting — ask technical questions, schemes, and products anytime at:
thanvuong.vn/vi/products
Hotline: 0867 957 568 | thanvuong.vn
Source: Correia, B.; Pacheco, O.; Rocha, R.J.M.; Correia, P.L. Image-Based Shrimp Aquaculture Monitoring. Sensors 2025, 25(1), 248. https://doi.org/10.3390/s25010248 — Read the full text on PubMed Central
The original article was published under a Creative Commons Attribution 4.0 (CC BY 4.0) license, allowing translation and republication with proper attribution. The Vietnamese version is adapted and compiled by Thần Vương for shrimp farmers; all data remains unchanged from the original.
All illustrative images in this article are originals from the authors' group (Figures 3, 7, 8, 10, 12, 13 in the original), reused under CC BY 4.0 with attribution. Image captions in Vietnamese were compiled by Thần Vương.
The ShrimpFarming image dataset is made freely available by the authors for research purposes at img.lx.it.pt/ShrimpFarming.