In Part 1, the data showed that Western consumers buy seafood for peace of mind — safety and taste matter far more than brand. Part 2 answers the next questions: where that peace of mind comes from, how to communicate it, and how the Chinese market — the nearest and the largest — really works.
In Part 2
- How to talk to consumers — farmers, certification and packaging
- Decoding the Chinese market — freshness, safety and the real value of the BAP logo
SECTION 3 — How to talk to consumers
1. Who do consumers trust?
Section 2 concluded that consumers buy "peace of mind". The next question is: whom do they listen to for that peace of mind?
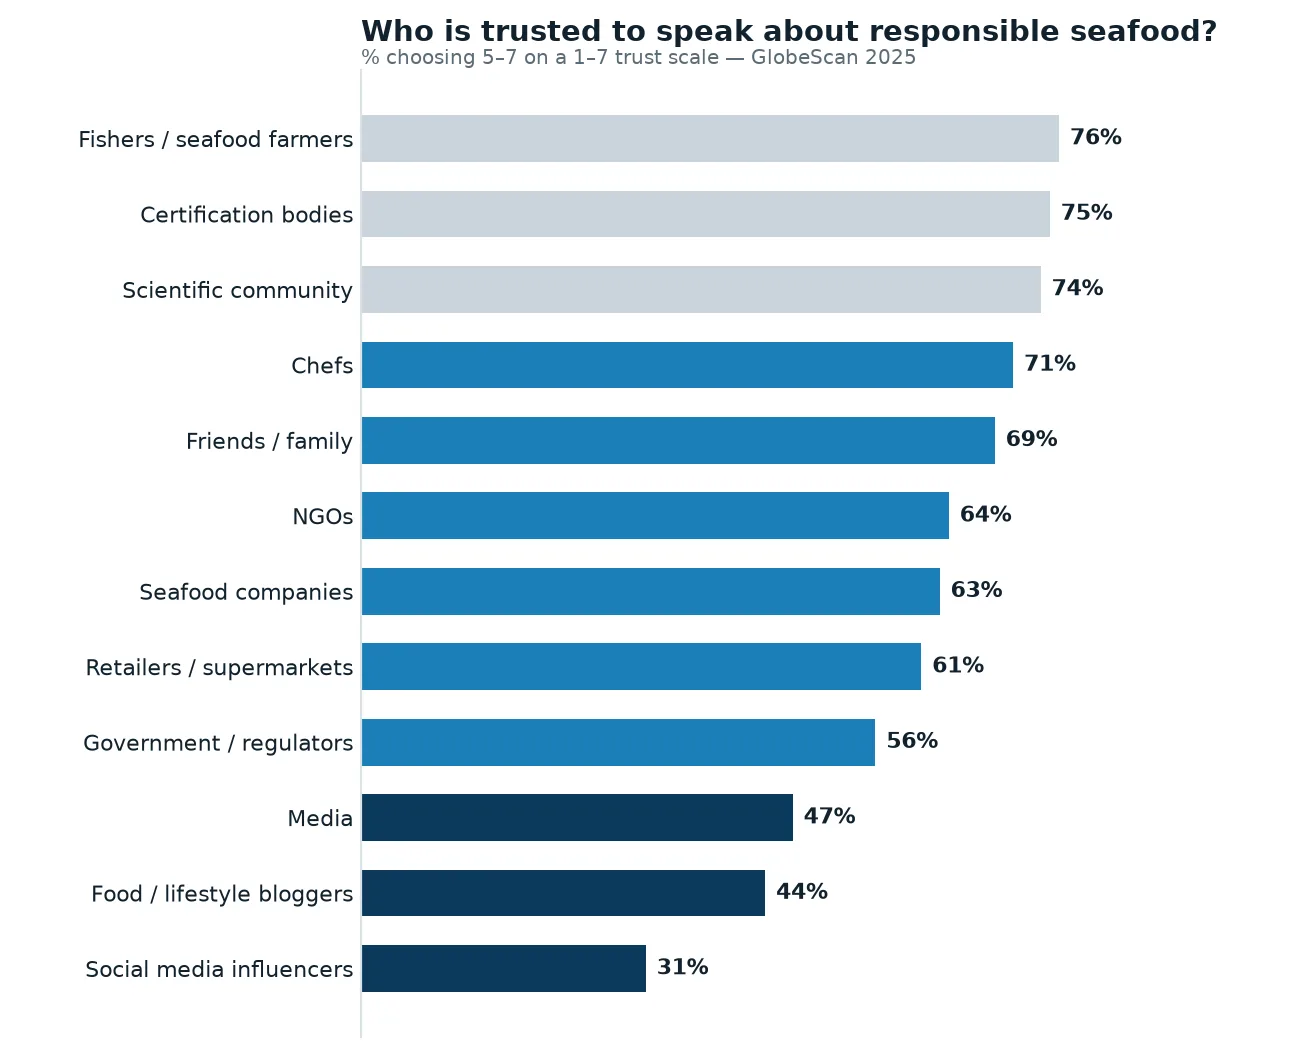
The results overturn many familiar marketing assumptions:
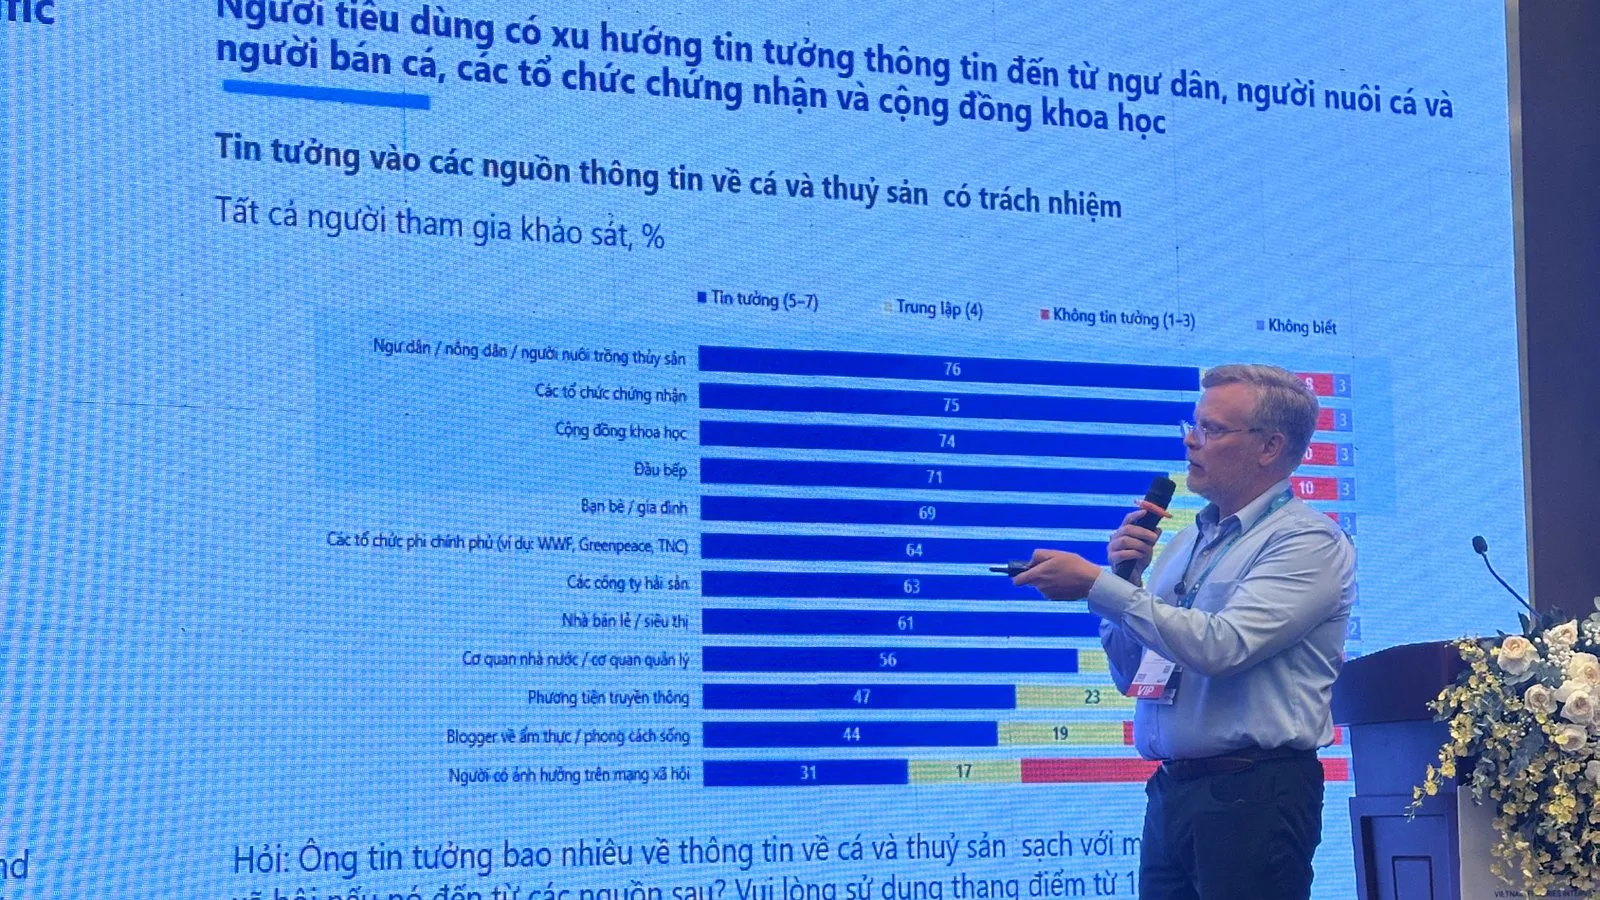
- Fishers and seafood farmers top the list at 76% — higher even than government regulators (56%).
- Certification bodies come second (75%), almost level with the scientific community (74%).
- Social media influencers come last, at only 31% — lower even than the media (47%).
This deserves serious thought from Vietnam's seafood industry. The most persuasive story is not found in the marketing department but at the pondside: real farmers, real processes, verified by an independent organization. That is exactly the two most trusted sources combined.
According to these data, investing in KOLs to sell shrimp to the US or Europe means putting money into the least trusted source of information.
2. Where to say it?
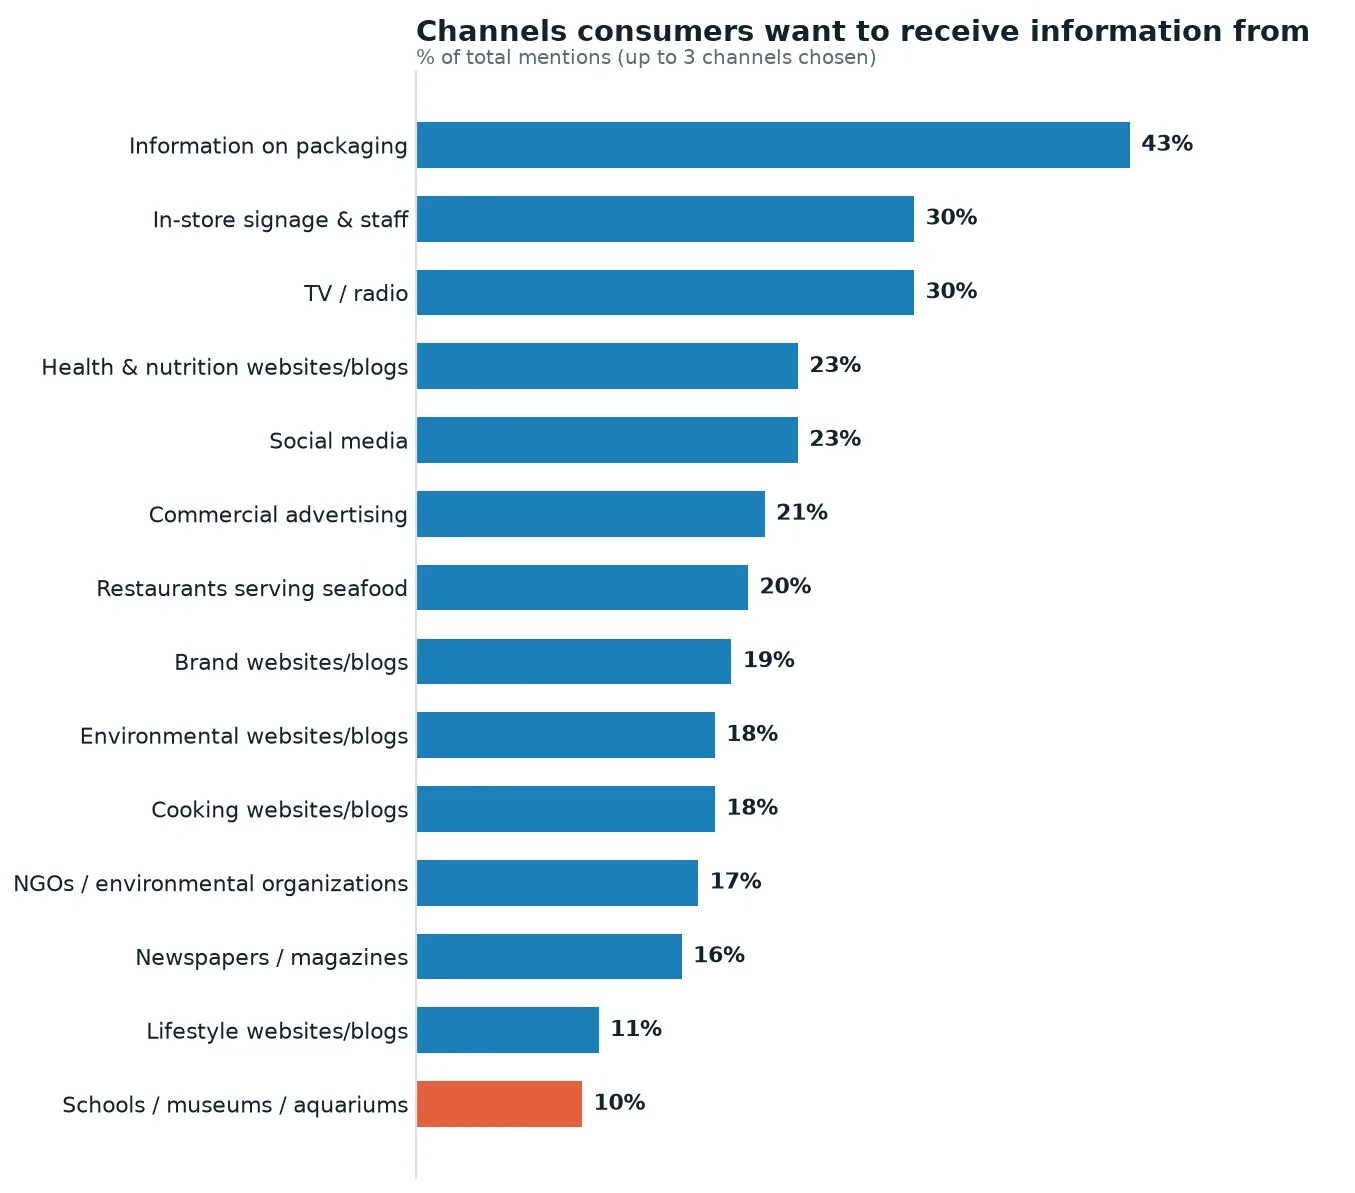
Product packaging is far ahead of every other channel at 43%, double commercial advertising (21%) and nearly 1.5 times TV/radio or in-store signage (both 30%).
A note on generations: Gen Z (37%) and Millennials (29%) favor social media far more than other age groups — but even for them, social media still does not beat packaging.
Put the two charts above together, and the most effective communication strategy becomes very concrete:
Put accurate information on the packaging, and let the certification body vouch for it.
A few square centimeters on the back of a bag of frozen shrimp are more persuasive than an entire advertising campaign — provided the information there is true and verifiable.
3. Five opportunities for responsible seafood
GSA summed up the presentation in five points:
- Consumers want to become healthier and live more sustainably.
- Seafood is already seen as healthy, but concerns about safety and sustainability remain.
- Responsible practices and certification help close that gap and build trust.
- Transparency and clear communication reinforce exactly the values consumers care about — health, safety, responsibility.
- There is an opportunity to position farmed seafood as the protein of choice for health-conscious, sustainability-minded consumers.
Point 5 is the most noteworthy: farmed seafood does not need to apologize for being farmed. It has the chance to become the number one choice, not the cheap option.
4. China: the largest market, right next door
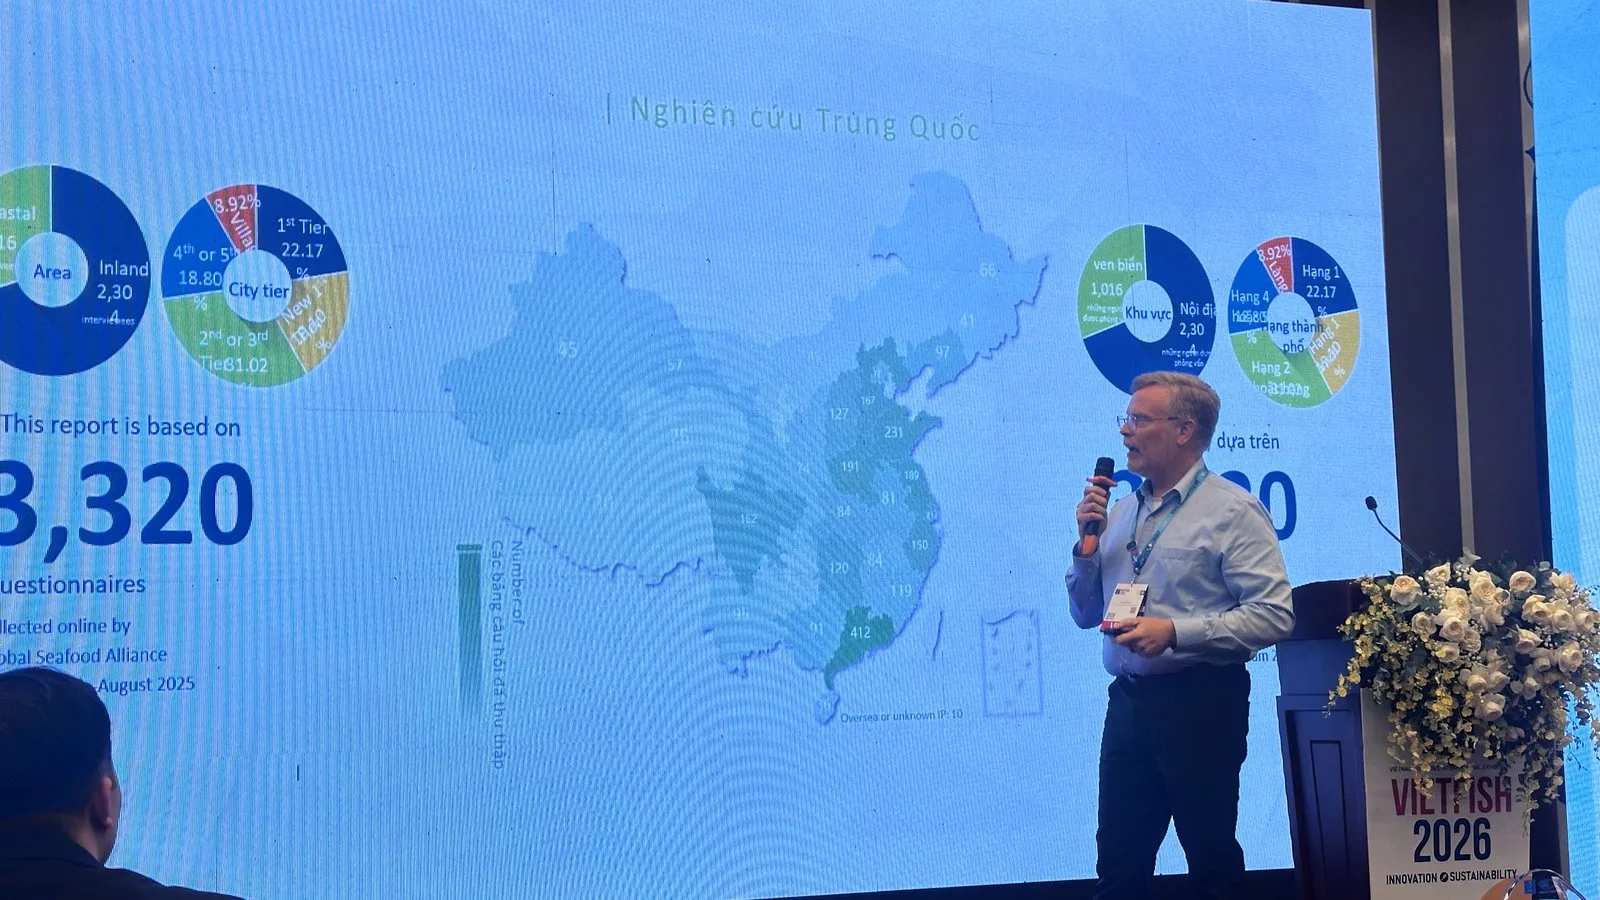
The final part of the presentation turned to a separate study carried out by GSA in China: 3,320 online survey responses, collected from June to August 2025, ranging from tier-1 cities to rural areas, including 1,016 people in coastal regions and 2,304 in inland regions.
Consumption is rising:
- Earlier surveys: about 22.02 kg/person/year
- New survey: 24.38 kg/person/year, of which household consumption is about 14.02 kg
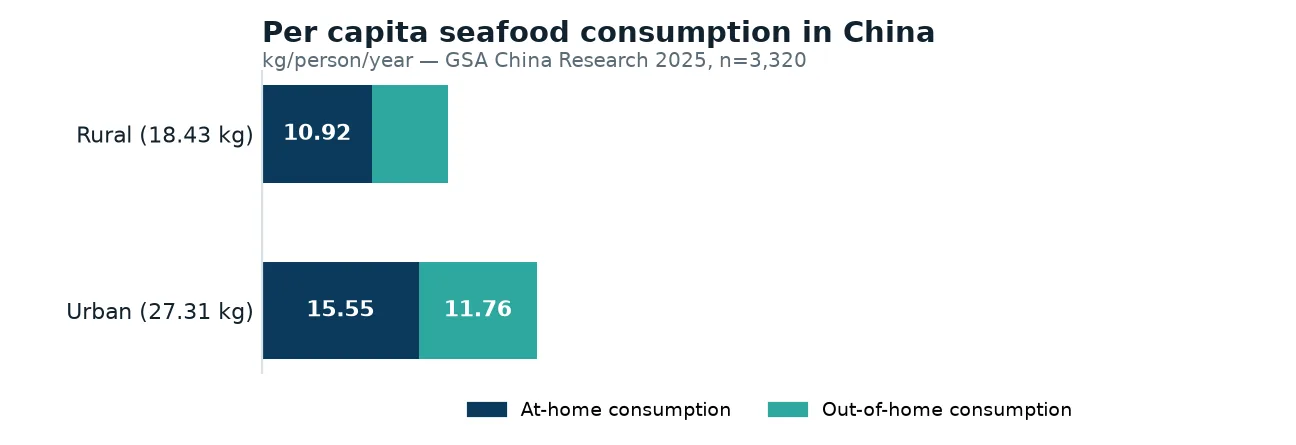
The urban–rural gap is very clear: 27.31 kg versus 18.43 kg. The urban figure alone is more than three times US consumption (8.7 kg — see Part 1).
Frequency is high too:
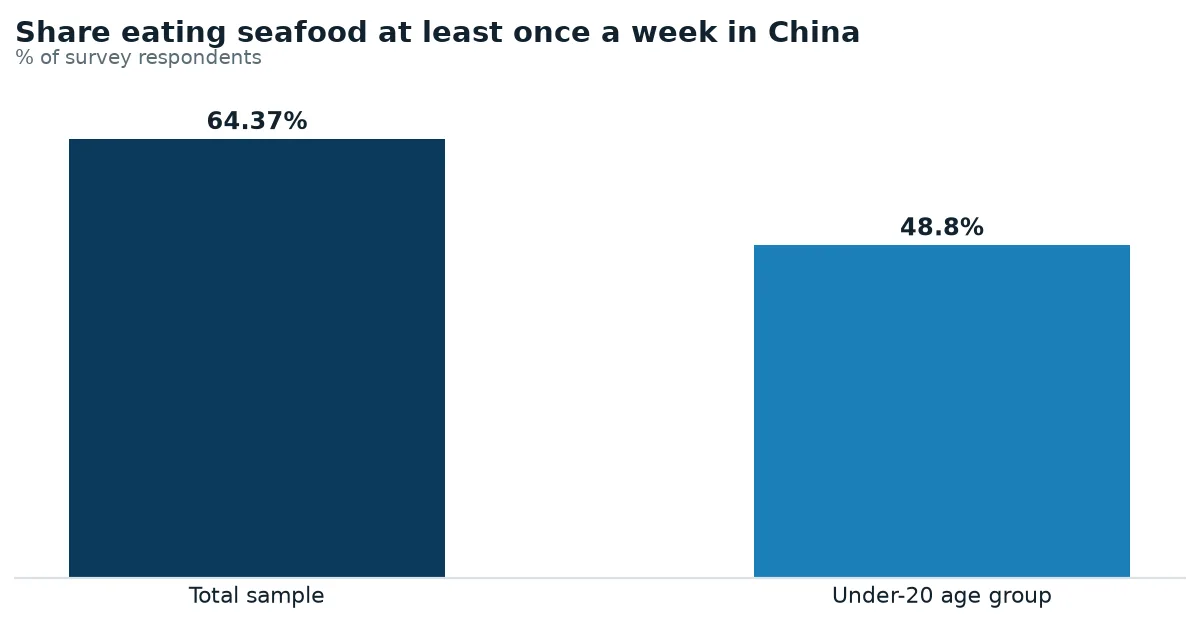
64.37% of Chinese consumers eat seafood at least once a week — higher than the 63% who "eat it at home every week" in the five Western countries. The rate is fairly even across age groups from 20 upward, but the under-20 group reaches only 48.80% — a long-term warning that mirrors the Gen Z situation in the West.
5. What do Chinese consumers want improved?
When asked the open question "which aspects of Chinese seafood need improvement", answers were tallied by number of mentions:
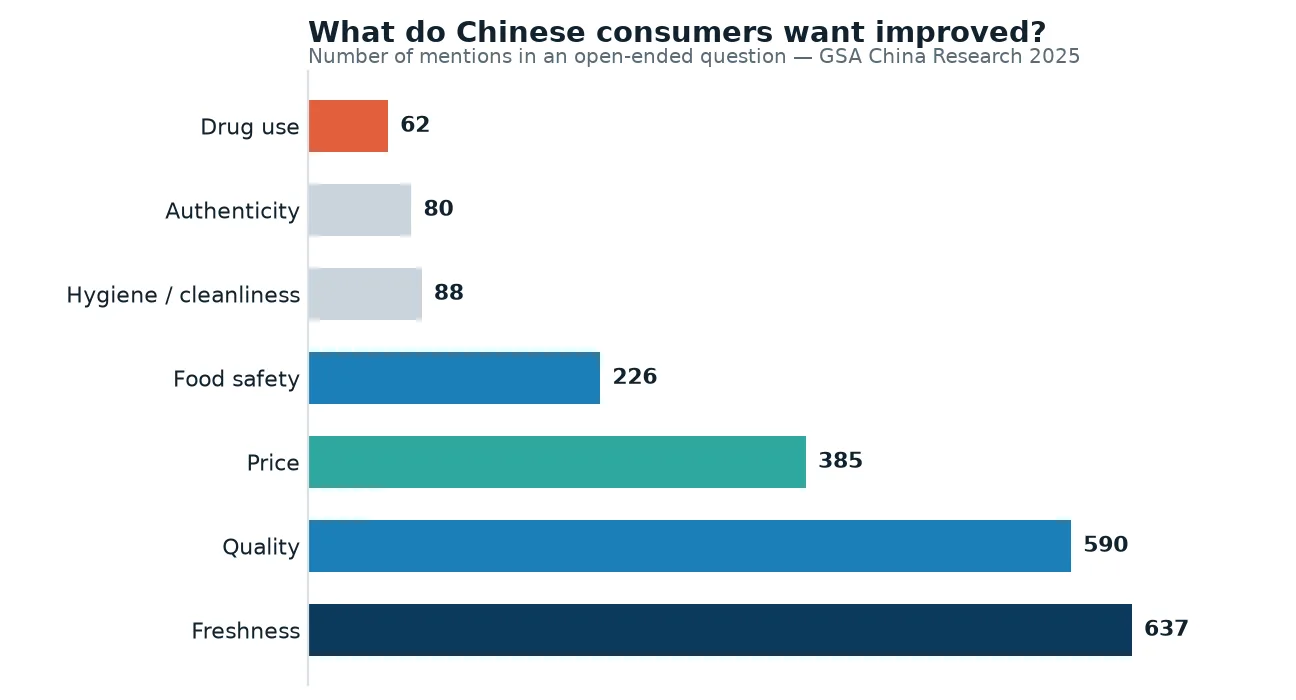
- Freshness (637 mentions) — far ahead of every other factor, repeating the 2024 survey result
- Quality (590) and price (385)
- Food safety (226), hygiene (88), authenticity (80)
- Use of medicines (62) also appears on the list
The three typical responses quoted on the slide all revolve around one theme: fresher products and faster delivery are needed; online shopping needs a good logistics chain to guarantee freshness; and in inland areas, almost only frozen products are available, and fresh products are very hard to buy.
In other words, the bottleneck of the Chinese market is the cold chain, not demand. Whoever solves the fresh – fast – traceable problem for those 2,304 inland consumers will open up a huge market that most suppliers have not yet reached.
SECTION 4 — Decoding the Chinese market
Section 3 ended with one conclusion: China is a large, nearby, growing market, and the bottleneck is the cold chain. Section 4 digs into three questions that any exporter needs to answer before entering this market: Who buys? What do they base their decisions on? And does certification help sell at a higher price?
1. First surprise: income is less decisive than we think
The 2024 survey had shown that the intention to consume seafood was strongly influenced by income. But when coastal and inland regions were separated in the 2025 survey, the picture changed completely.
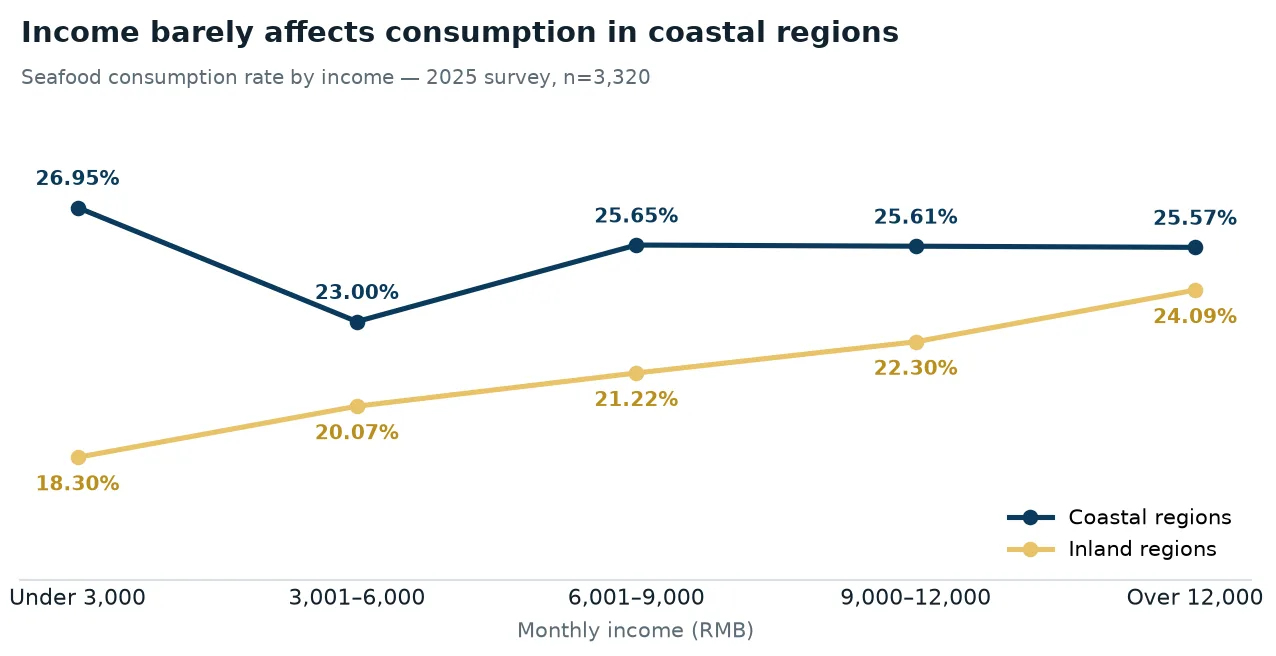
In coastal regions, the line is almost flat: from the income group below 3,000 RMB to the group above 12,000 RMB, the consumption rate only hovers around 25–27%. People on low incomes eat almost as much seafood as people on high incomes.
Inland regions show the opposite: 18.30% → 20.07% → 21.22% → 22.30% → 24.09%. The richer people are, the more they eat.
GSA explains this difference with three factors: eating habits, relatively lower prices, and easier access in coastal regions.
The practical implication for Vietnamese businesses: in coastal China, seafood is already an everyday food — competition there is about price and freshness. In inland regions, seafood is still an "upgrade" that rises with income — this is where the room for growth lies, but the logistics problem described in Section 3 has to be solved.
For comparison, the 2024 survey showed a much larger gap on the consumption intention measure: coastal rose from 40.40% to 63.89% across income brackets, inland from 36.02% to 52.14%.
2. What really drives the choice?
This is a chart worth printing out and pinning up in the QC room.
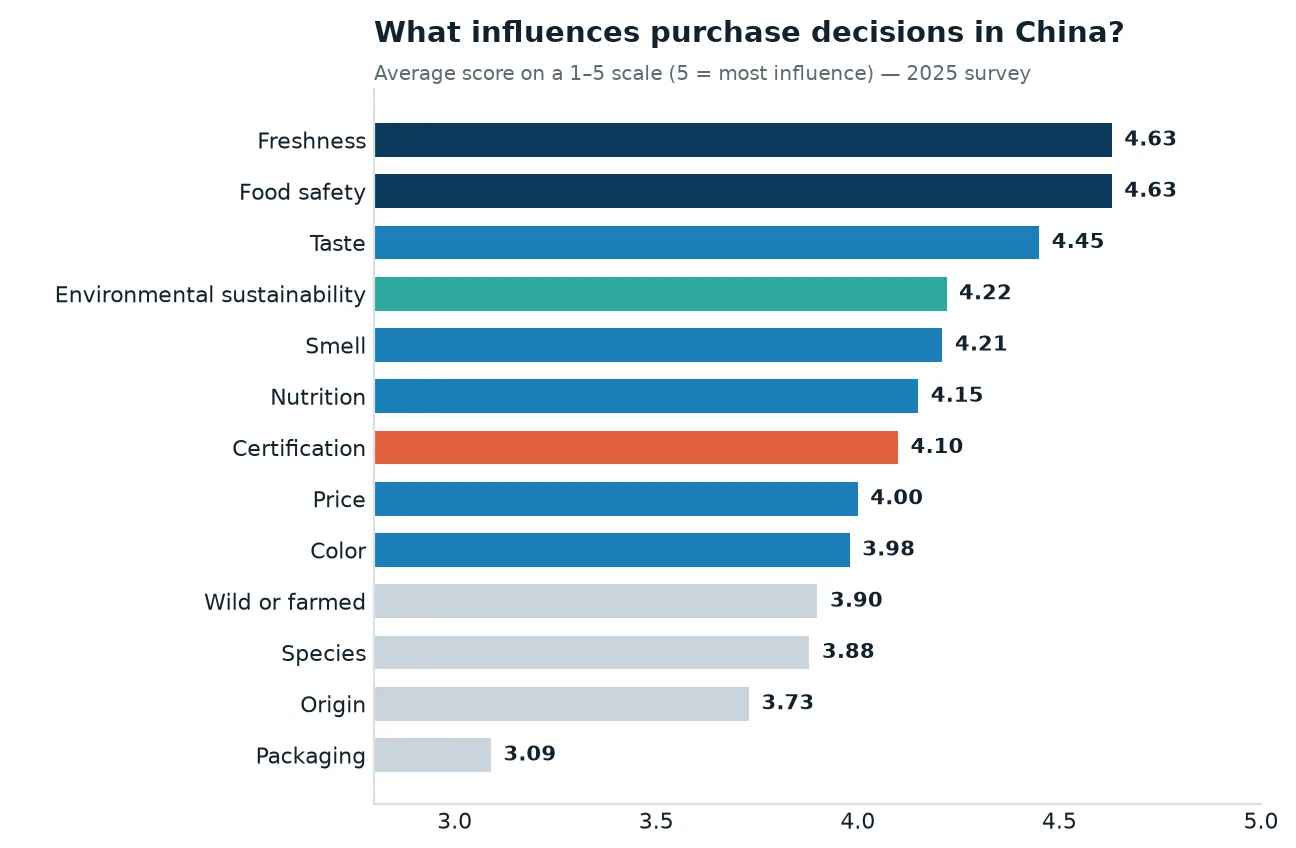
On a scale of 1–5 (5 = most influence):
| Factor | Score |
|---|---|
| Freshness | 4.63 |
| Food safety | 4.63 |
| Taste | 4.45 |
| Environmental sustainability | 4.22 |
| Smell | 4.21 |
| Nutrition | 4.15 |
| Certification | 4.10 |
| Price | 4.00 |
| Color | 3.98 |
| Wild or farmed | 3.90 |
| Species | 3.88 |
| Origin | 3.73 |
| Packaging | 3.09 |
Three things stand out:
- Freshness and food safety tie for first place, close to the maximum (4.63/5). They differ by just 0.0003 points.
- Certification (4.10) ranks above price (4.00). Chinese consumers see a certificate as more important than the figure on the price tag.
- "Wild or farmed" scores only 3.90 and "origin" 3.73 — clearly lower. This means prejudice against farmed seafood in China is much weaker than in the West (recall from Part 1: 26% of Western consumers choose wild fish to avoid antibiotics).
The 2024 survey adds further average scores: food safety 4.60; environmental sustainability 4.31; traceability 4.14; social responsibility 3.75; animal health and social welfare 3.63.
GSA stresses that across more than 9,700 survey responses since 2023, concern for being "environmentally friendly" appears consistently in the Chinese market — contrary to the common assumption that this market cares only about price.
3. What is the BAP logo worth?
This part is a direct answer to the question "does investing in certification pay off".
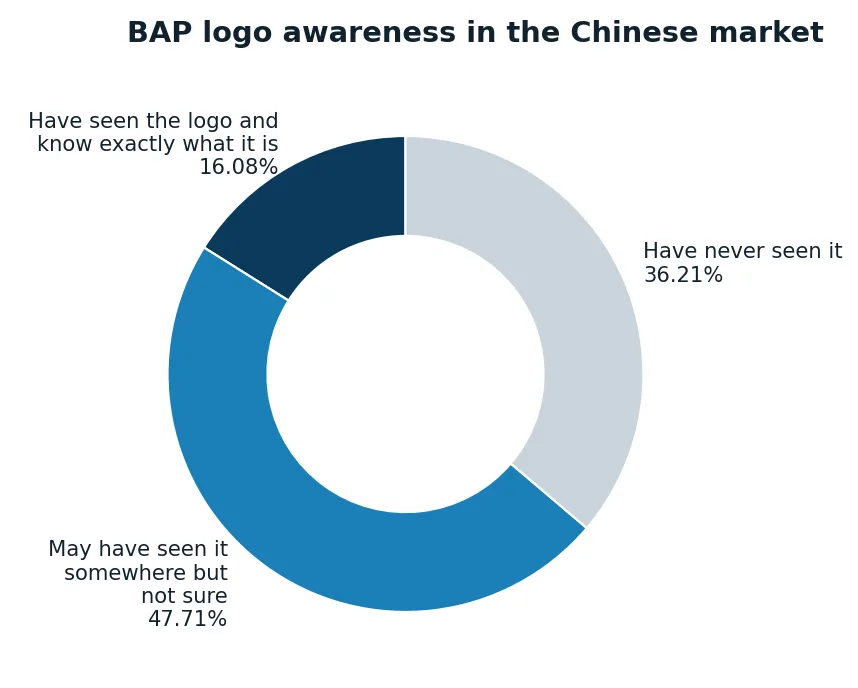
Awareness is still modest but growing: 16.08% have seen the logo and know exactly what it is; 47.71% say they "may have seen it somewhere but are not sure".
The important part comes next.
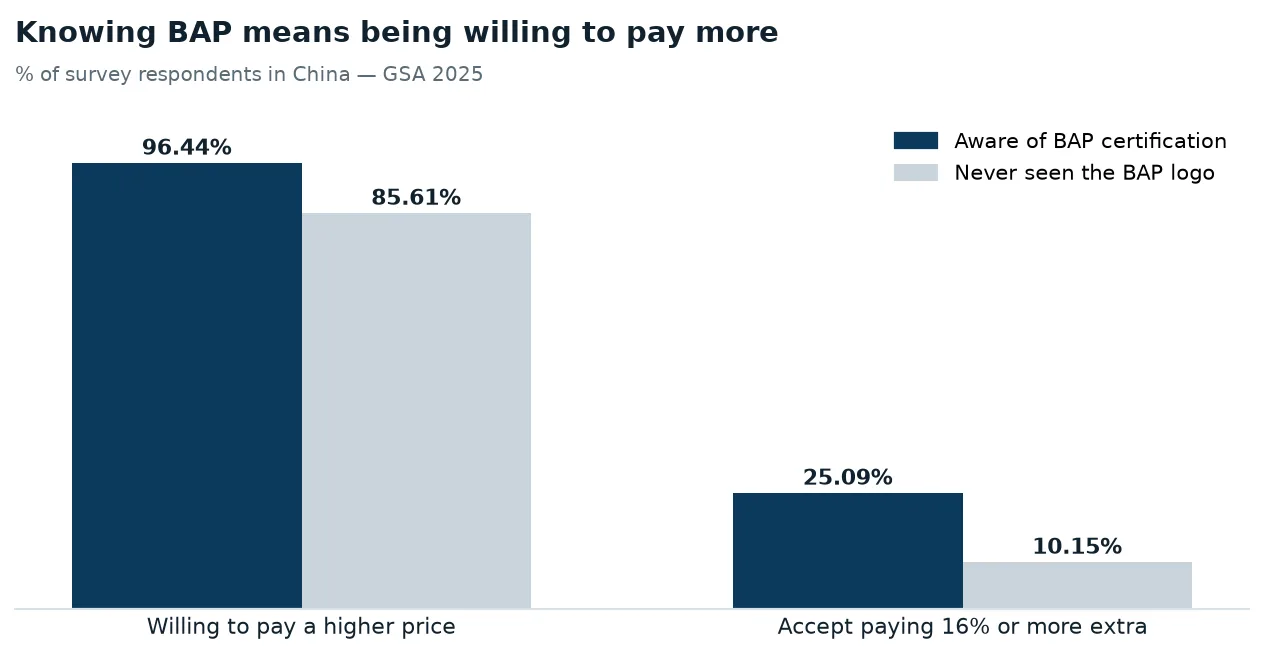
- Among those already aware of BAP certification: 96.44% are willing to pay a higher price.
- Among those who have never seen the logo: 85.61%.
- The gap is much wider at high premiums: 25.09% of those who know BAP accept paying 16% or more extra, compared with only 10.15% of those who do not.
In other words: awareness of certification multiplies by 2.5 the share of customers who accept a double-digit price premium.
This is one of the rare figures in the industry that converts a compliance investment directly into profit margin. It also shows that certification does not create value automatically — it creates value only when the end buyer recognizes it. That is why packaging (Section 3) and point-of-sale communication matter so much.
Closing the series: a single chain of logic
Joined together, the four sections tell a single story:
| Section | Question | What the data say |
|---|---|---|
| 1 | Where is the market heading? | Demand is large but shifting; diversification is a must |
| 2 | How do consumers buy? | Supermarkets, frozen, decided by safety & taste |
| 3 | How do we talk to them? | Through farmers, certification bodies and packaging |
| 4 | What is the Chinese market like? | Freshness + safety are king; certification ranks above price |
And all four sections converge on exactly one point: quality and safety are created in the pond, then proven by certification and communicated through packaging.
A clean shrimp cannot say that by itself. But a clean shrimp that is certified and has packaging that tells its story sells in all five Western markets and in China alike — at a higher price.

Digitize your farm records with Nuôi Lời
Record feed, water conditions, cast-net sampling, medicines and costs right at the pond; export multi-sheet Excel reports that support traceability records in line with ASC and GMP — exactly what standards such as BAP require. Free, sign in with your phone number, no email needed.
Try Nuôi Lời →