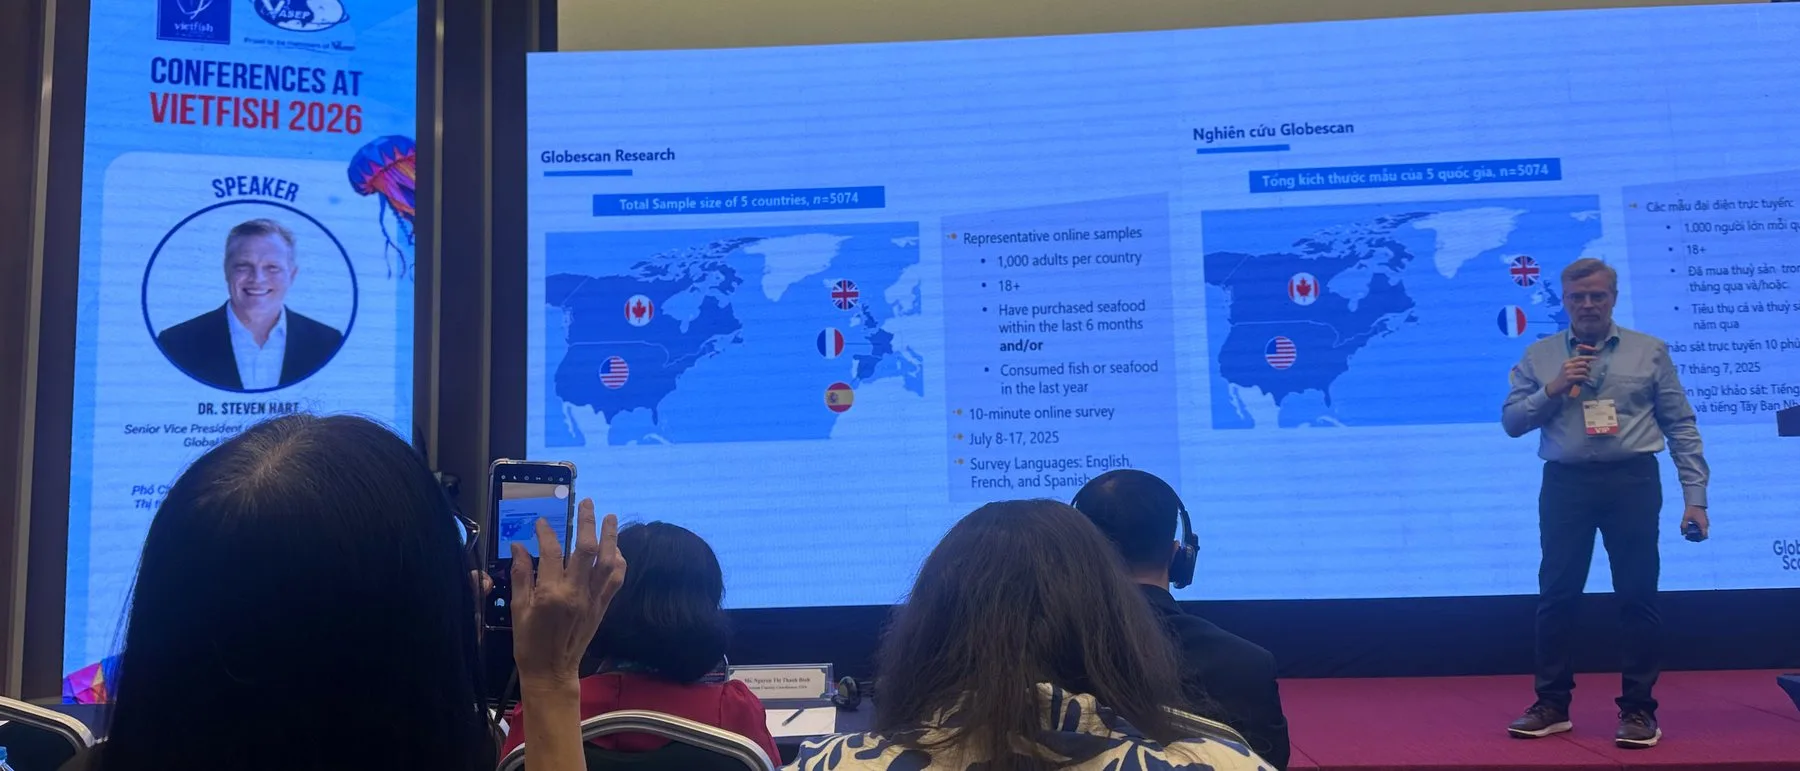
There is a very simple question that most people in the industry get wrong: which animal protein do people eat the most worldwide? The answer — along with dozens of accompanying figures — was just presented by the Global Seafood Alliance at the VIETFISH 2026 conference. This article comes in two parts, built around four questions that every Vietnamese seafood business now has to answer — Part 1 is below, and Part 2 is already online.
In Part 1
- The global market is shifting — seafood is the No. 1 protein, but the EU is shrinking
- How consumers buy seafood — supermarkets, frozen products, safety and taste
SECTION 1 — The global seafood market is shifting
Seafood: the largest source of animal protein on the planet
There is one fact that everyone working in the industry should know by heart: seafood is the most internationally traded protein for human consumption.
Globally, seafood is also the most consumed source of animal protein, with more than 1 billion people relying on seafood as the main source of protein in their daily diet (Statista 2026):
| Protein group | Consumption volume |
|---|---|
| Seafood | ~170 million tonnes |
| Poultry | ~140 million tonnes |
| Pork | ~125 million tonnes |
| Beef | ~75 million tonnes |
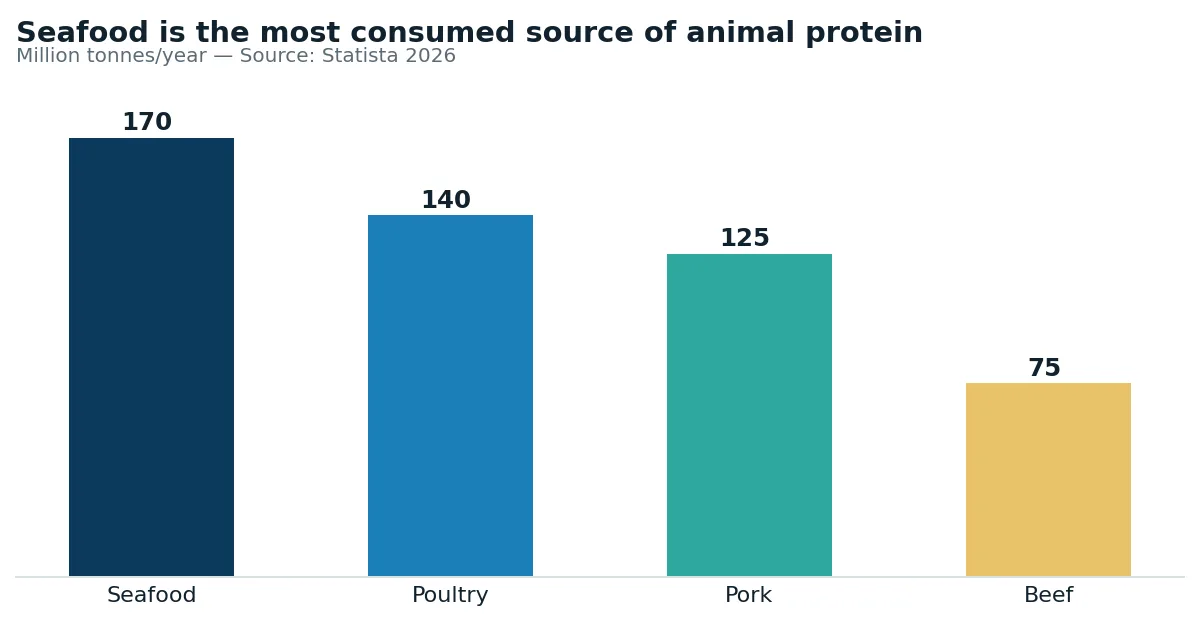
In other words, seafood leads the global protein race — 30 million tonnes ahead of poultry, and more than double beef. This is the foundation that gives Vietnam's entire farming and processing industry room to grow.
But leading in volume does not mean it is easy to sell.
The paradox: demand is large, but traditional markets are shrinking
Dr. Steve Hart's presentation pointed to a reality that many Vietnamese exporters have clearly felt over the last few seasons: global volatility is redrawing the seafood market map.
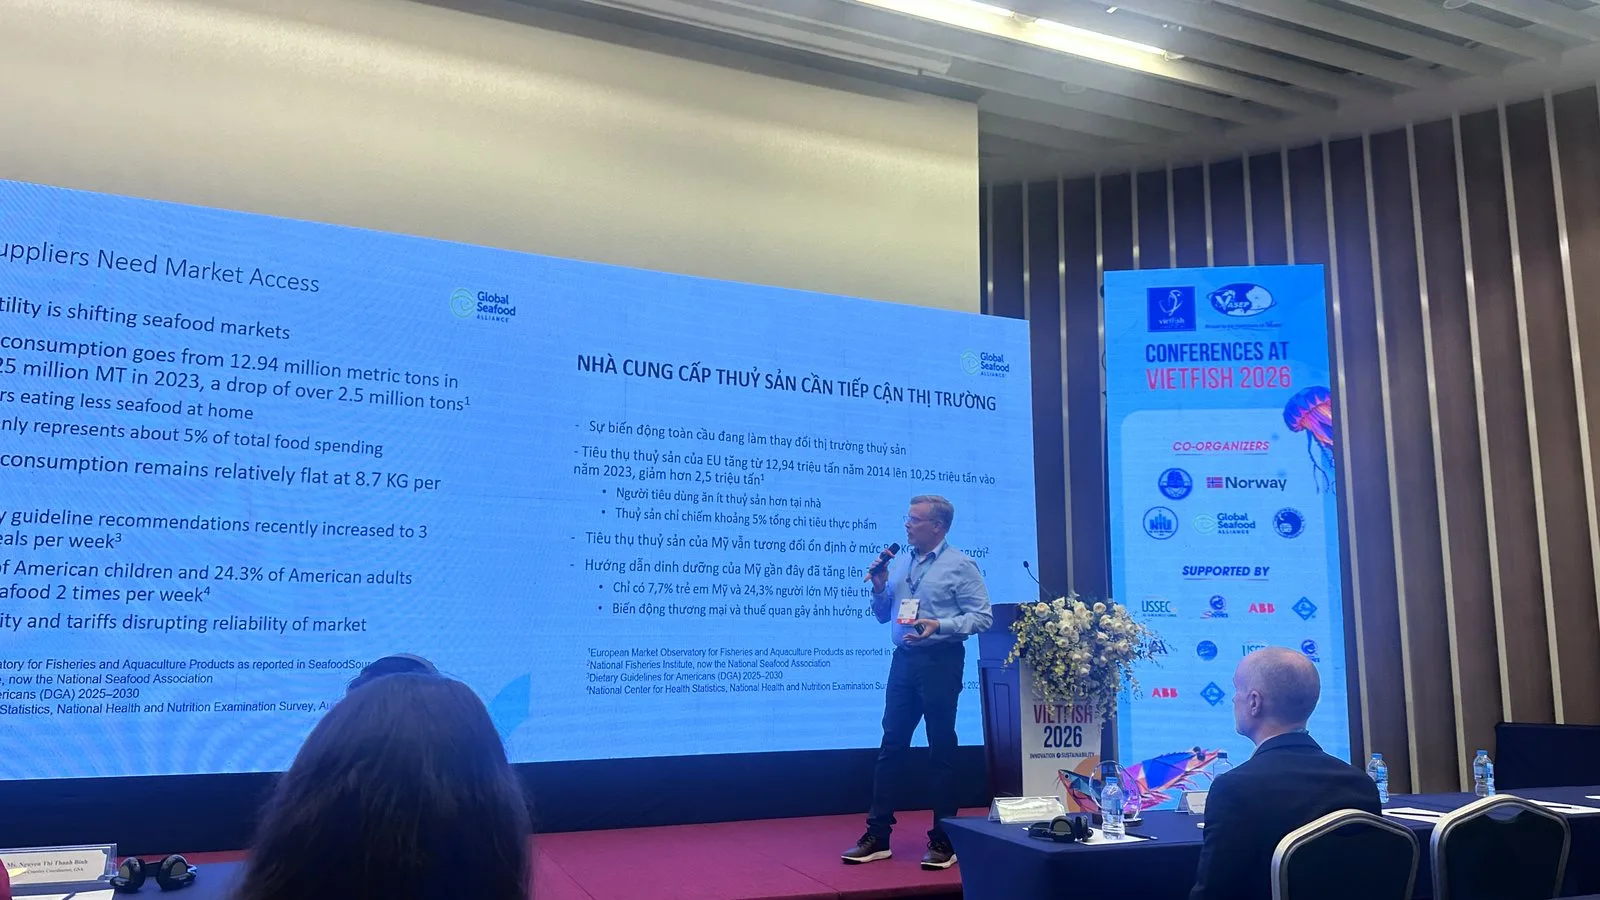
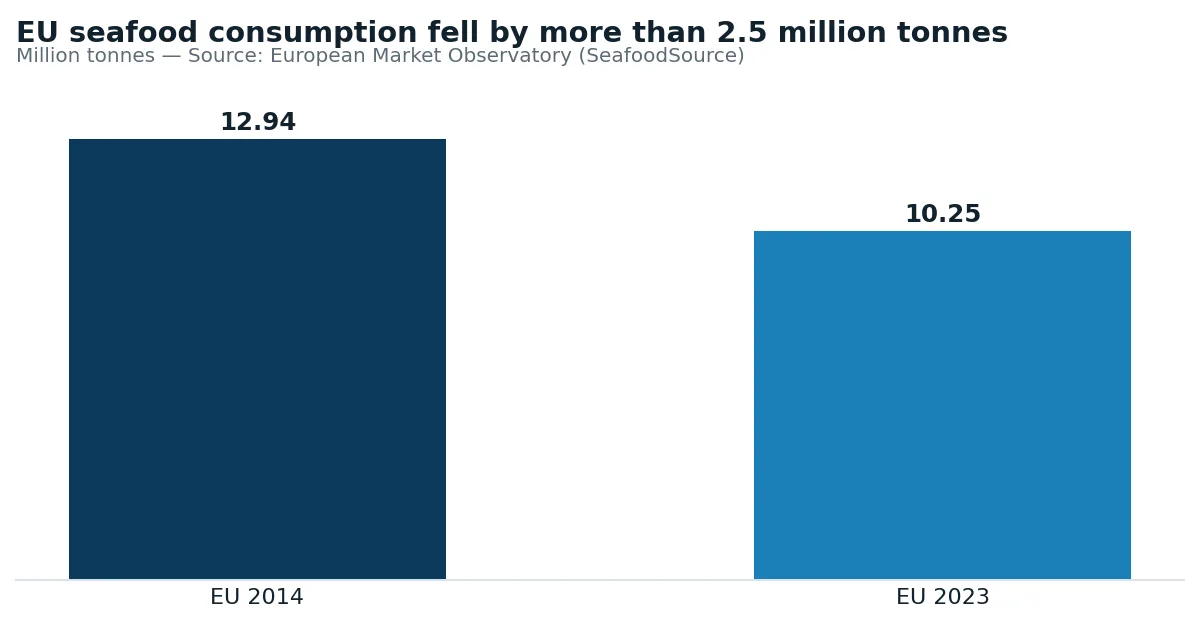
In Europe: - Seafood consumption fell from 12.94 million tonnes (2014) to 10.25 million tonnes (2023) — a loss of more than 2.5 million tonnes in just under a decade. - Consumers are eating less seafood at home. - Seafood accounts for only about 5% of total food spending — a very thin share, and one of the first to be cut when inflation rises.
In the United States: - Consumption is still relatively stable at 8.7 kg/person/year — but "stable" in the sense of flat for many years in a row. - The Dietary Guidelines for Americans (DGA 2025–2030) recently raised the recommendation to 3 seafood meals per week. - Yet only 7.7% of children and 24.3% of adults in the U.S. actually eat seafood 2 times a week. - And above all: trade volatility and tariff policy are making the market less reliable.
The gap between "3 meals/week recommended" and "fewer than 1/4 of adults eating 2 meals/week" is the biggest market gap the industry is leaving open. It is not a supply problem — it is a problem of market access and communication with end consumers.
Trade volatility is speeding up market diversification
GSA surveyed processors holding BAP (Best Aquaculture Practices) certification about their main market today and their main market in the future. The results show a shift that is well worth thinking about.
Current primary market (number of companies choosing it):
- North America: 34
- Europe: 17
- Australia / New Zealand: 11
- United Kingdom: 8
- China: 7
- Latin America: 6
- Japan: 5
- Self-driven: 4
- Middle East: 3
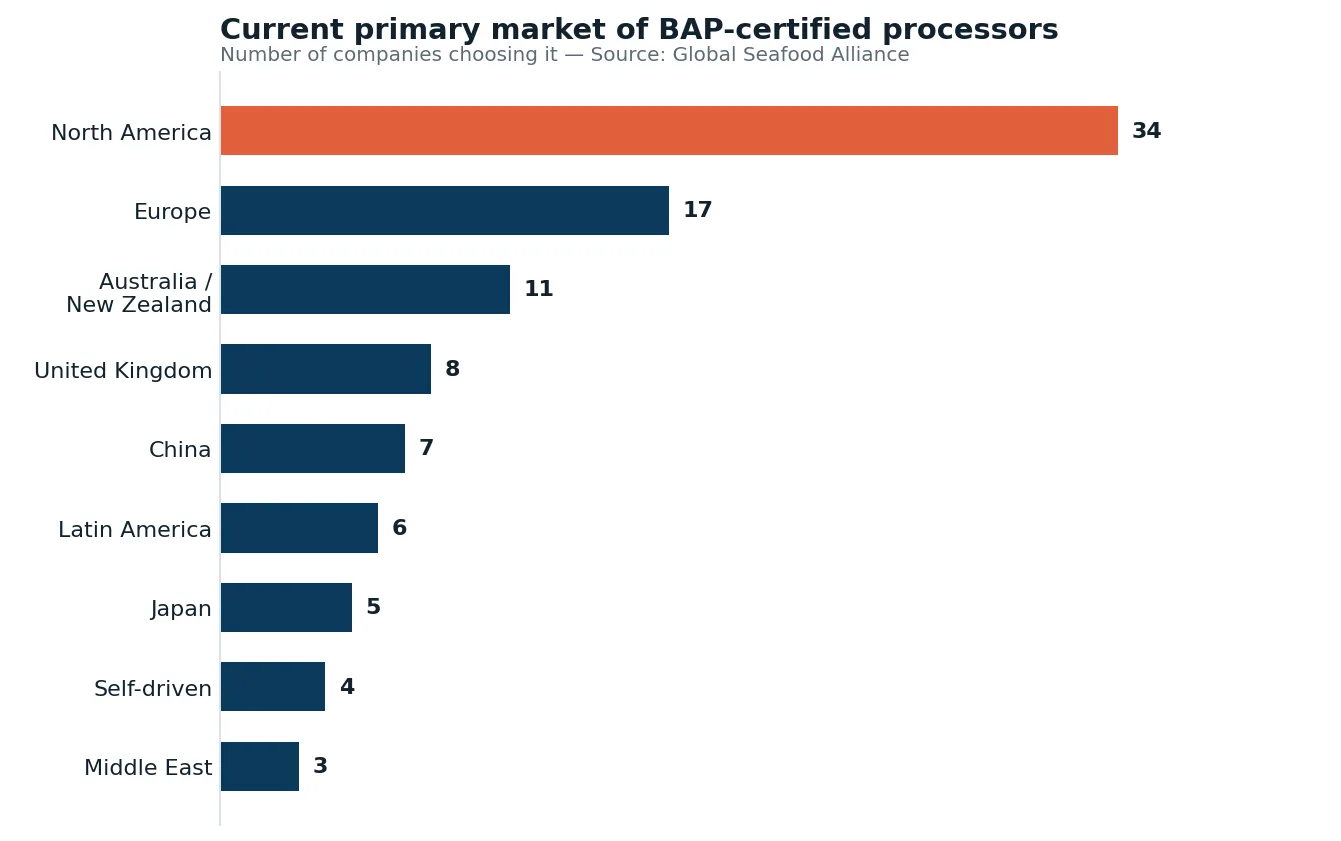
Today's picture is very clear: North America dominates, with nearly half of all choices. This kind of market structure brings good sales in favorable times — and a very high concentration risk when tariffs or technical barriers hit.
The future primary market looks completely different. The largest slice is only about 27%, and the rest is split among a long list of destinations: Europe, Japan, Australia, China, North America, the United Kingdom, Russia, Belt and Road Initiative countries, Latin America, the Middle East and South Korea.
The takeaway is short: no company wants to bet everything on a single market anymore. Diversification is no longer a "nice-to-have" strategy — it has become a mandatory line of defense.
The good news: consumers still love seafood
Amid the figures on falling consumption, the GlobeScan study that GSA presented at the conference offers a much more optimistic view.
Study scope: 5 countries (U.S., Canada, UK, France, Spain), total sample n = 5,074, 1,000 adults aged 18 and over in each country, who had bought seafood in the past 6 months and/or eaten fish or seafood in the past year. A 10-minute online survey, conducted July 8–17, 2025.
Key findings — "Seafood is a staple":
- 87% like eating fish / seafood
- 63% eat seafood at home at least once a week
- 62% believe seafood is one of the healthiest sources of protein
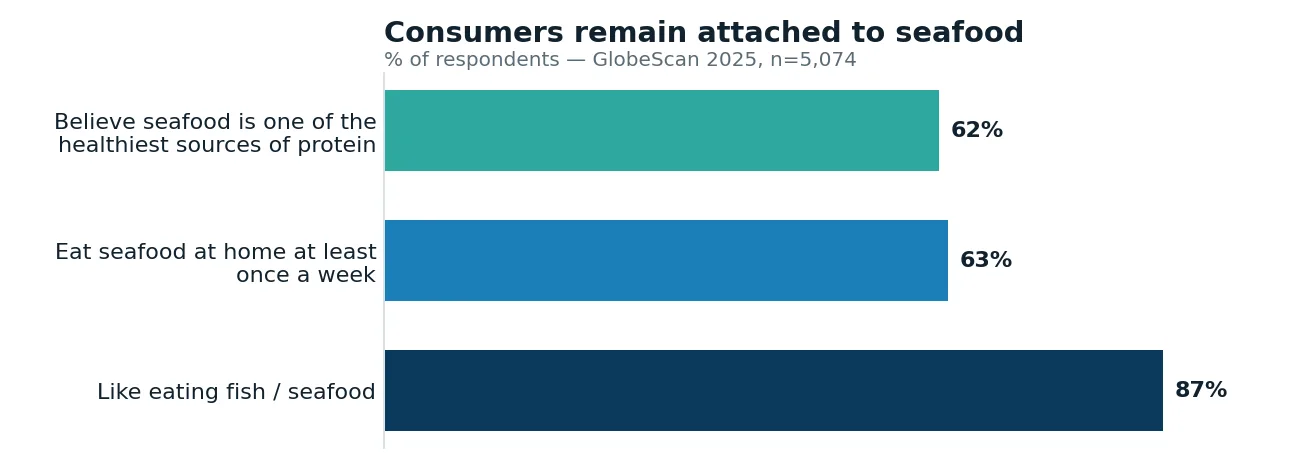
This is the key point: consumers are not turning their backs on seafood. They still like it, still trust it, still eat it. The problem lies in frequency, in price, in trust in quality and origin — not in demand.
With 87% of consumers already well disposed, every extra percentage point in consumption frequency is a real opportunity for Vietnamese suppliers.
What does this mean for Vietnamese businesses?
Putting it all together, Section 1 leaves three conclusions:
- Underlying demand is still very large — seafood is the No. 1 animal protein worldwide.
- Market concentration risk is real — the EU is shrinking, the U.S. is flat, tariffs are unpredictable.
- Consumers are still on board — 87% like eating it, 62% see it as one of the healthiest proteins.
The real question is not "how much can we farm", but "who can we sell to, with which certification, and with how consistent a quality".
Coming up in Section 2: BAP certification and the story of market access — why quality at the source, in the pond, decides the ticket to export, and what Vietnamese businesses need to prepare for the coming phase of market diversification.
SECTION 2 — How consumers buy seafood
1. Seafood meals happen in home kitchens, not in restaurants
This may be the most important data for anyone making products for export.
How often people eat fish/seafood, by location (%):
| Location | Once a week or more | About once a month | Never |
|---|---|---|---|
| At home | 63 | 20 | ~1 |
| Restaurant | 16 | 25 | 9 |
| Fast food | 14 | 14 | 39 |
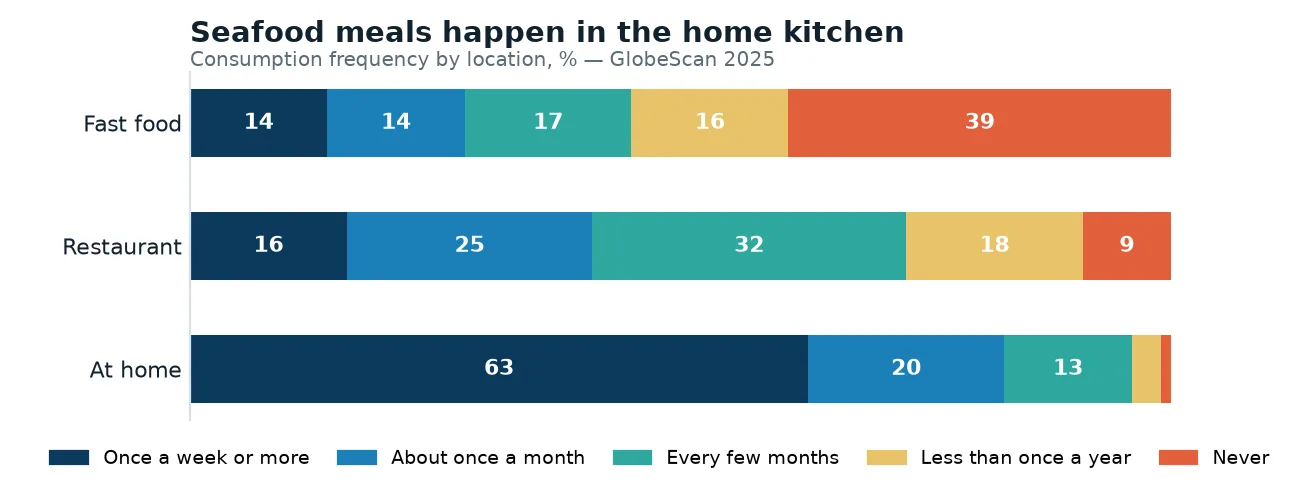
More than 6 in 10 consumers eat seafood at home at least once a week. Meanwhile, nearly 4 in 10 have never eaten seafood at a fast-food chain.
Differences by country (eating at home once a week or more): Spain 78%, UK 68%, France 66%, Canada 56%, U.S. 46%.
Differences by generation: Boomers 67%, Millennials 66%, Gen X 63%, Gen Z 56%.
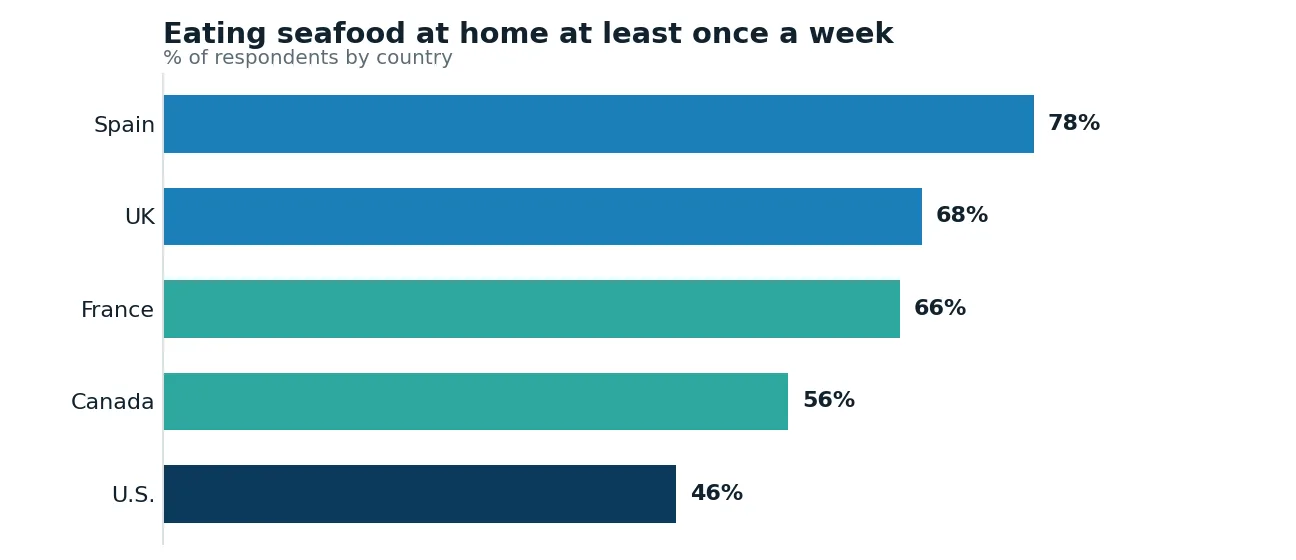
Two conclusions for Vietnamese producers:
- Products must be designed for the retail channel and the family meal, not for restaurant kitchens.
- Southern European markets (Spain, France) eat seafood at home far more often than North America — a notable signal, given the market diversification discussed in Section 1.
2. Where they buy: supermarkets dominate
Among those who bought seafood in the past 6 months (n = 4,340):
- Supermarket / grocery store (including online): 82%
- Local fishmonger, market, specialty store: 41% (Spain 67%, France 50%)
- Restaurant (including takeout / delivery): 30%
- Membership / bulk retail store: 24% (U.S. 44%, Canada 34%)
- Fast-food chain: 14%
- Convenience store: 11%
- Deli / coffee shop: 10%
- Meal delivery service (meal kit): 6%
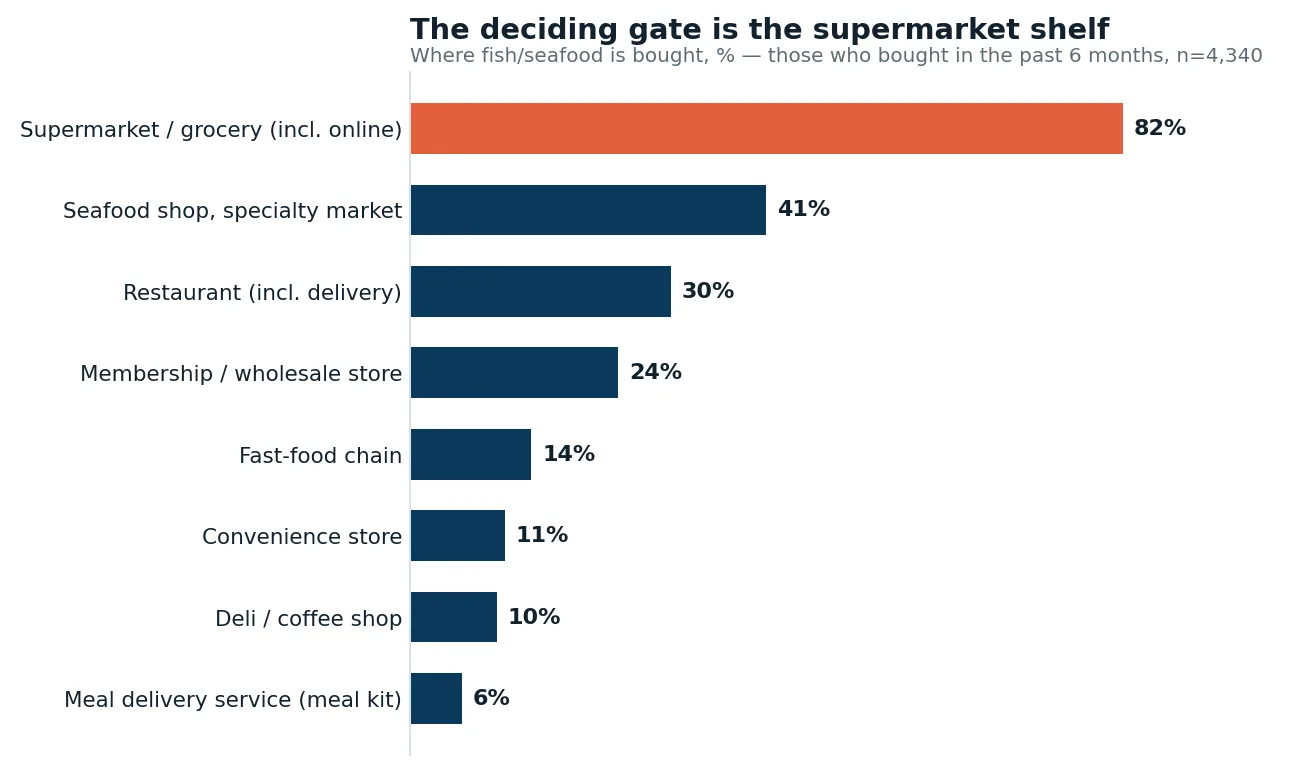
In other words: the deciding gate is the supermarket shelf. Whoever meets the supermarket buyers' standards reaches more than 8 in 10 consumers. Whoever does not barely exists in the market.
3. What form they buy: frozen leads
Share buying "often + sometimes":
- Frozen fish/seafood: 77% (31% often)
- Fresh pre-packed fish/seafood: 72%
- Canned / brined / pickled fish/seafood: 70%
- Fresh fish from a counter/fishmonger: 65% (Spain 83%, France 79%)
- Cooked / ready-prepared fish/seafood: 61%
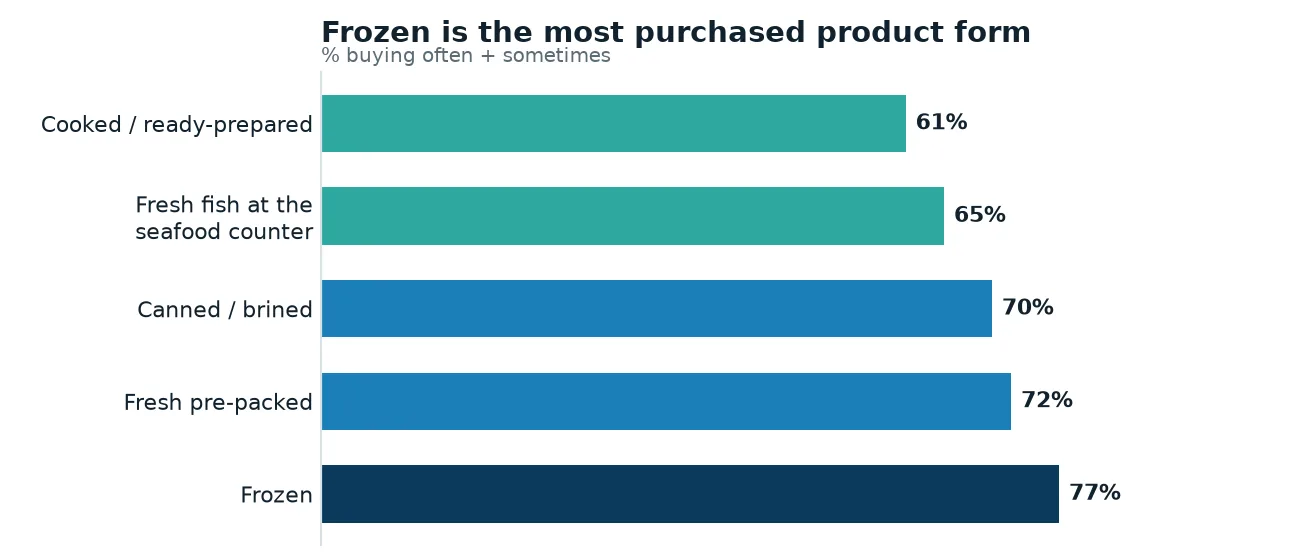
In consumers' minds, frozen is no longer a "second-class" choice — it is the most popular product form. This is a major structural advantage for Vietnamese shrimp and pangasius.
4. What really drives their choice?
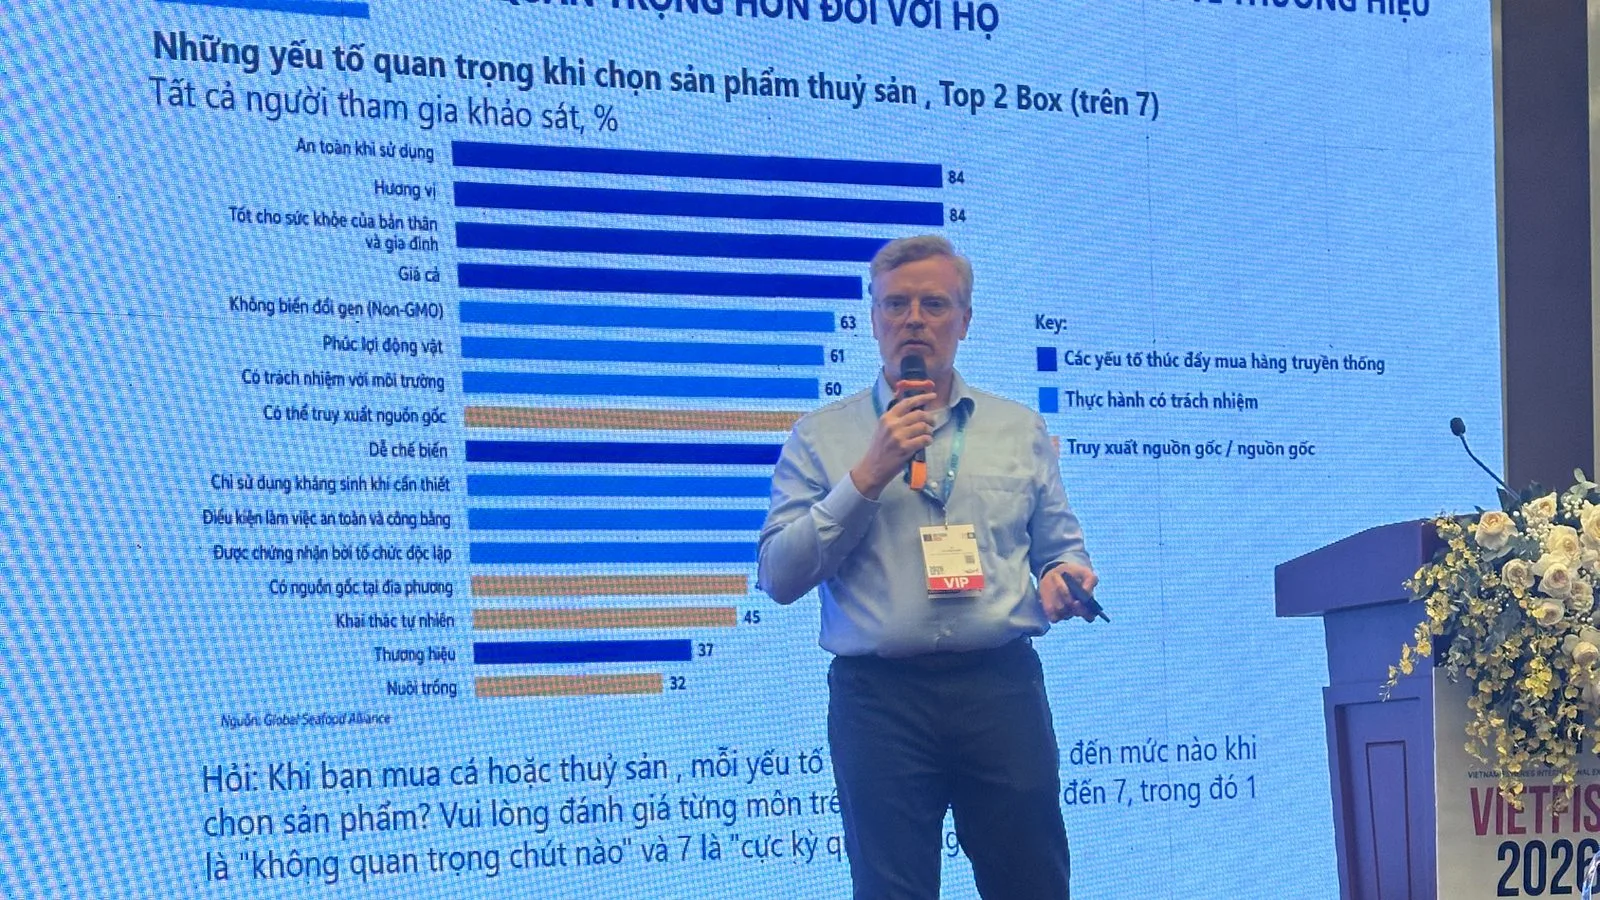
This is the most valuable part of the presentation. Factors that matter when choosing seafood products (Top 2 Box, 7-point scale):
| Factor | % |
|---|---|
| Safe to eat | 84 |
| Taste | 84 |
| Healthy for me and my family | high |
| Price | high |
| Not genetically modified (Non-GMO) | 63 |
| Animal welfare | 61 |
| Environmentally responsible | 60 |
| Antibiotics used only when necessary | in the middle group |
| Certified by an independent organization | in the middle group |
| Wild-caught | 45 |
| Brand | 37 |
| Farmed | 32 |
The surprising message: brand sits near the bottom of the table (37%), far below safety and taste.
Western consumers do not buy a "shrimp brand". They buy peace of mind. And that peace of mind has to be proven by something else — not by a company logo.
5. Farmed or wild: where is the weak spot of farmed seafood?
About 2 in 5 consumers buy both farmed and wild seafood, and 1 in 5 have no idea where the products they buy come from — in total, about 64% do not really pay attention to origin.
But when asked about the reasons for their preference, the picture becomes very clear:
Reasons for choosing FARMED seafood: more affordable (32), available year-round (28), easy to find in stores (23), can be certified / responsibly farmed (21), traceable (20), healthier (19), more consistent quality/taste (18), less pressure on wild fish stocks (17), better for the environment (15).
Reasons for choosing WILD seafood: more natural (42), better taste/texture (30), seen as higher quality (26), to avoid antibiotics / chemicals (26), not raised in captivity (20), more nutritious (18).
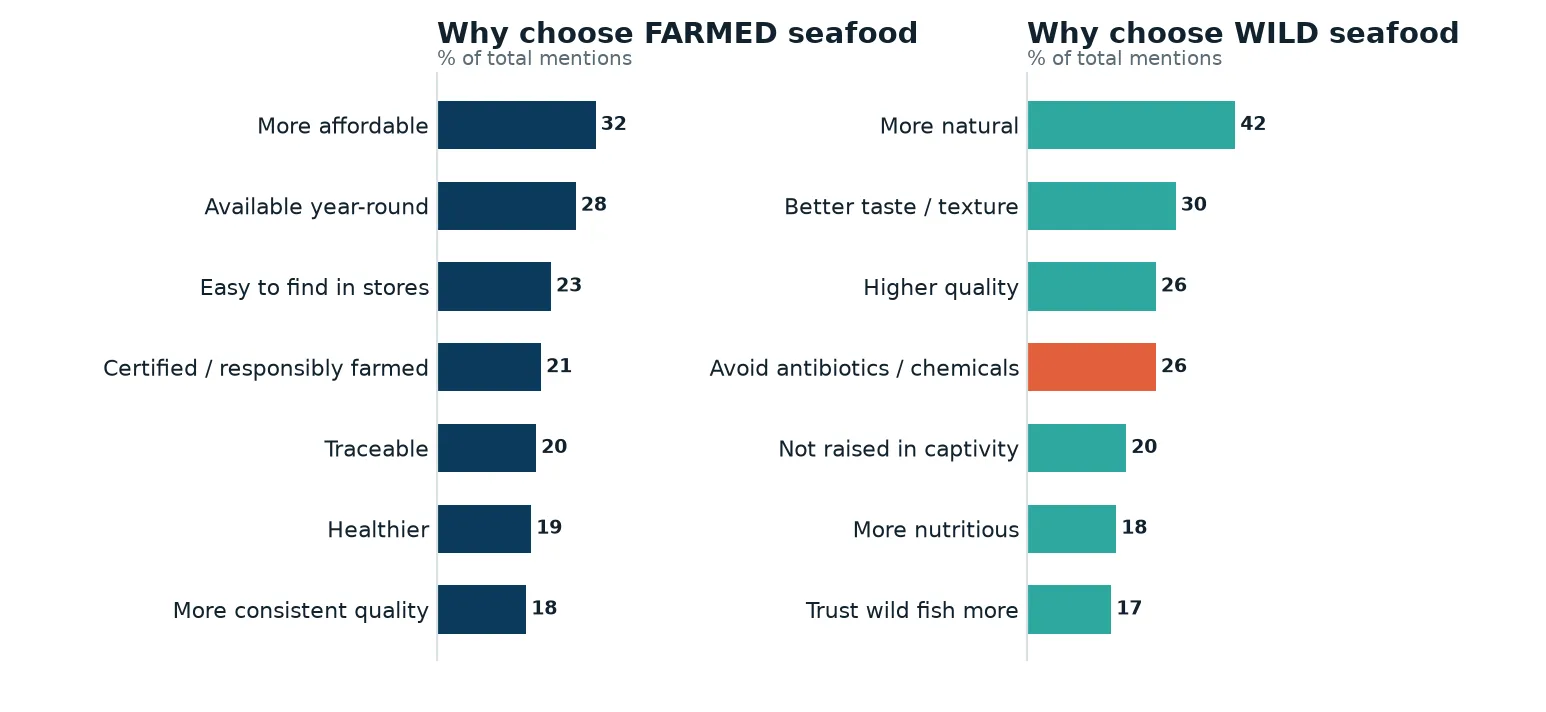
Look closely at that 26%. One of the top four reasons consumers turn away from farmed seafood is concern about antibiotic and chemical residues.
And this is exactly where Vietnam's entire value chain — from hatcheries, ponds, feed and aquaculture veterinary products to processing plants — can make a direct difference. Controlling drug use — the right dose, the right indication, the full withdrawal period before harvest — is no longer just a matter of internal compliance. It is marketing on the other side of the world.
Notably, two of the top reasons in favor of farmed seafood are certification (21) and traceability (20). In other words, the farming sector already has the tools to fix its own weak spot.
6. Certification builds trust
GSA presented two key figures:
- 42% say that buying certified products reflects their personal values.
- 40% are willing to pay more for responsibly farmed seafood.
Four in ten consumers accept a higher price. That is profit margin, not cost.
But ecolabel awareness still has a big gap. How often people buy ecolabeled products (%):
| Country | Buy as often as possible | Sometimes | Never heard of it |
|---|---|---|---|
| Total | 14 | 30 | 35 |
| France | 22 | 42 | 17 |
| Spain | 17 | 36 | 35 |
| UK | 12 | 24 | 40 |
| Canada | 11 | 25 | 43 |
| U.S. | 9 | 22 | 43 |
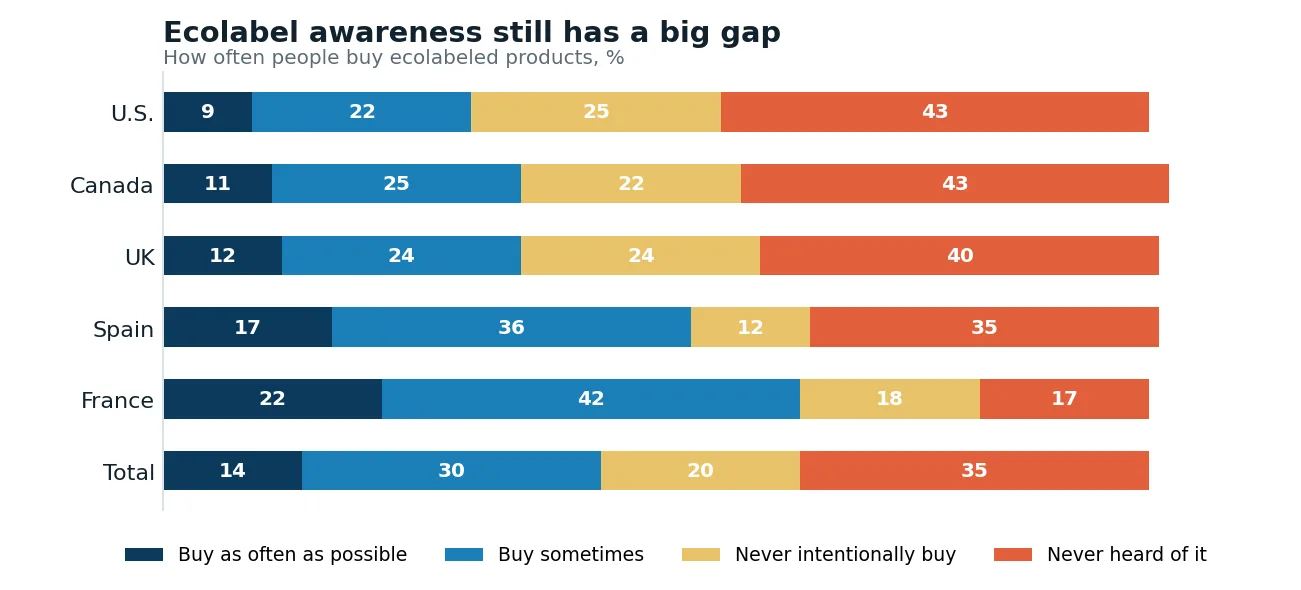
More than 4 in 10 consumers actively buy ecolabeled products — but more than 1 in 3 have never heard of the concept, and in the 65+ age group this figure rises to 48%.
7. Trust in the BAP logo
When asked how much they would trust a product carrying the BAP logo (scale of 1–7, with scores of 5–7 counted as "trust"):
| Market | Trust (%) | Distrust (%) |
|---|---|---|
| Total | 66 | 7 |
| Spain | 74 | 6 |
| U.S. | 67 | 9 |
| Canada | 67 | 6 |
| UK | 62 | 7 |
| France | 59 | 8 |
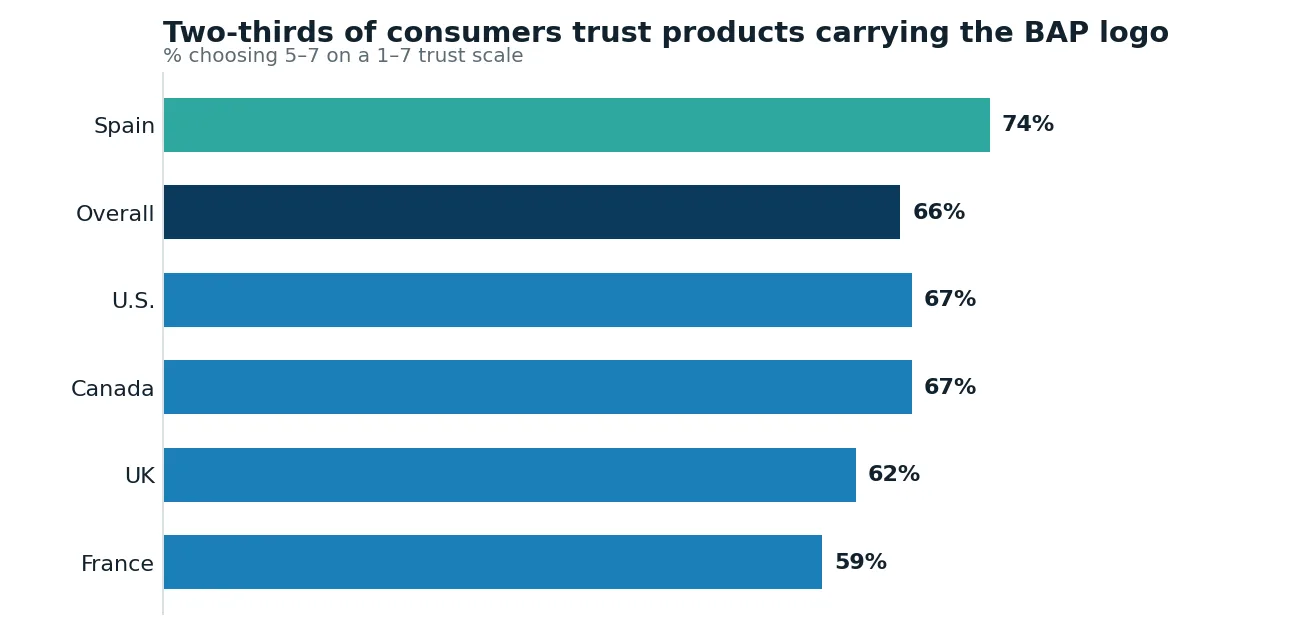
Two-thirds of consumers trust products carrying the BAP logo, while only 7% do not. For a B2B certification that rarely appears on retail packaging, this is a remarkable figure.
Three lessons for Vietnamese businesses
-
The battle is fought at the supermarket counter, with frozen products, for the family meal. Design products and packaging for exactly that setting.
-
Nobody buys your shrimp brand — they buy peace of mind. Safety and taste (84%) are far ahead of brand (37%). Investing in quality and residue control brings a higher marketing ROI than investing in brand identity.
-
Antibiotics are the weak spot, certification is the answer. 26% choose wild fish to avoid antibiotics/chemicals; 40% are willing to pay more for responsibly farmed seafood; 66% trust the BAP logo. The gap between those two numbers is the added value that Vietnam's supply chain can capture — starting with how we manage animal health right at the pond.
In Part 2
SECTION 3 — How to talk to consumers: why farmers and certification bodies are trusted more than key opinion leaders (KOLs), and why packaging is the No. 1 communication channel.
SECTION 4 — Decoding the Chinese market: freshness, food safety, and the real value (in %) of the BAP logo.

Digitize your farm records with Nuôi Lời
Record feed, pond environment, cast-net samples, treatments and costs right at the pond; export multi-sheet Excel reports that support traceability records in line with ASC and GMP — exactly what standards such as BAP require. Free, sign in with your phone number, no email needed.
Try Nuôi Lời →